Look, I'll cut straight to it – Solana is doing that thing again. You know, that thing where it starts creeping up and everyone's nervously checking their phones every five minutes?
Right now, SOL is chilling at $232.29, up 1.63% in the last day. Not earth-shattering, but here's what's got me (and probably you) glued to the charts: we might be witnessing the formation of a textbook higher high pattern. And if you've been around crypto long enough, you know what that could mean.
The million-dollar question? Are we about to see a beautiful breakout that sends SOL soaring past $250, or are we setting ourselves up for a painful reality check?
Let’s dig into this together.
➤ What's Actually Happening With the Chart?
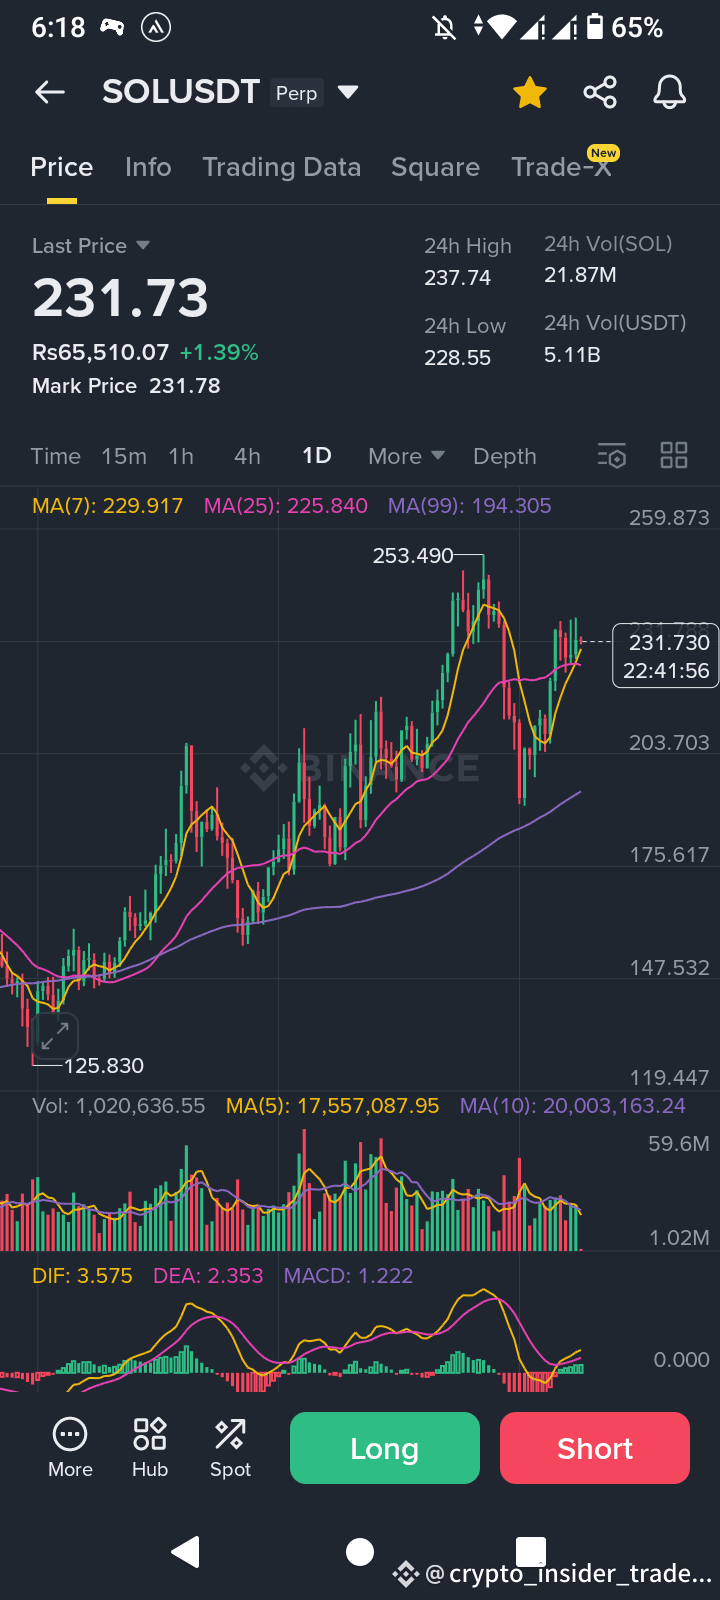
I've been staring at the SOL/USDT chart, and honestly, it's pretty exciting stuff. Since that rough patch back in July when SOL was languishing around $145, it's been consistently making higher highs and higher lows. That's the kind of pattern that gets traders' hearts racing.
Here’s what jumped out at me:
✓ The Moving Averages Are Perfectly Aligned
This is textbook bullish setup territory.
▶ The 5-day MA is sitting at $230.72
▶ The 10-day at $224.20
▶ The 20-day at $222.46
Price is dancing above all of them, which typically means the bulls are in control. When you see this kind of stacking, it's usually a green light for continuation.
✓ Momentum is Building (But Watch Closely)
▶ The MACD indicator is positive at 1.258, with the signal line crossing above – that's your momentum confirmation right there.
▶ The histogram is widening, suggesting acceleration.
➠ But here’s where I get cautious: this momentum only matters if the buying volume backs it up.
✓ Volume is Decent, Not Crazy
▶ 7.24 million SOL traded in 24 hours
▶ $1.69 billion in turnover
That's solid, but it's not the explosive volume you'd want to see for a major breakout. The volume bars show buyers stepping in on dips, which is encouraging, but we need more firepower.
✓ The Critical Zone
Right now, SOL is testing that $235–$237 resistance zone. This is the make-or-break level.
▶ In the last 24 hours, we hit a high of $237.65 before pulling back slightly.
A clean break above this with conviction? That confirms the higher high pattern.
A rejection? Well, that's when things could get uncomfortable.
➤ The Two Scenarios: Where Do We Go From Here?
Let me paint you both pictures, because pretending we know exactly what'll happen is just foolish.
♦ Scenario 1: The Breakout (The Fun One)
If SOL smashes through $237 with strong volume – and I mean strong, not just a weak push – we're looking at some serious upside.
▶ First target: $250 feels natural, matching those Fibonacci projections.
▶ If momentum really kicks in and the broader market cooperates: $265–$280 isn't a wild fantasy.
Think about it:
✓ Solana's fundamentals are actually solid.
✓ The network is handling transactions faster than ever.
✓ The ecosystem is growing, and there's real adoption happening.
If we get favorable macro conditions – maybe those Fed rate cuts everyone's hoping for, or some positive regulatory news – SOL could absolutely rip higher.
I've seen this movie before. When SOL gets going, it really gets going.
♦ Scenario 2: The Breakdown (The Painful One)
But let's be real about the downside risk, because that's equally important.
▶ If SOL gets rejected hard at $237 and drops below $227, things could turn ugly fast.
▶ First stop: 20-day MA around $222.
▶ If that doesn’t hold: a test of the $200 psychological level.
▶ Worst-case scenario – if Bitcoin dumps or macro conditions turn bad – we could even revisit $180.
The risk factors are real:
➠ Whale wallets could take profits.
➠ Bitcoin could drag everything down.
➠ Market might decide it's overbought and needs a breather.
With RSI hovering around 65–70 (classic “getting excited but not yet crazy” territory), there’s definitely room for a pullback.
➤ My Honest Take
Look, I'm leaning bullish here, but I'm not betting the farm.
✓ The chart structure is solid.
✓ The higher highs pattern is intact.
✓ Solana’s fundamentals support a higher valuation.
✓ The moving averages are lined up, momentum is building, and we’re clearly in an uptrend.
But – and this is important – we need to see that decisive move above $237 with volume. Without it, we’re just flirting with the idea of a breakout rather than actually breaking out.
If I had to put odds on it?
▶ 60–40 in favor of breaking higher, assuming Bitcoin doesn’t implode and macro conditions stay neutral to positive.
▶ But that 40% chance of a pullback is real enough that you better have your stop losses figured out.
➤ What Should You Actually Do?
Here's where I remind you that I'm just some person analyzing charts, not your financial advisor.
But if I were in this trade:
1️⃣ Watch that $237 level like a hawk.
2️⃣ A break above with volume? That’s your confirmation to add or enter, with targets at $250 → $265.
3️⃣ On the flip side, set a stop loss below $227, ideally around $220–222 where the 20-day MA sits.
That gives the trade room to breathe while protecting you if things turn south.
And honestly?
✓ Layer in some on-chain analysis too.
▶ Check Solana's active addresses.
▶ Monitor Total Value Locked (TVL) in DeFi protocols.
▶ Watch what the whales are doing.
Charts are great, but the full picture matters.
➤ The Bottom Line
Solana’s at a critical juncture.
✓ The higher high pattern is forming.
✓ The technicals are mostly bullish.
✓ The potential for a significant move higher is absolutely there.
But remember – crypto doesn’t care about our hopes and dreams. It does what it wants, when it wants.
So what’s it gonna be?
➠ Explosive breakout to $250 and beyond, or
➠ Harsh reality check back to support levels?
The next few days will tell us everything.
What do you think?
Are you bullish on SOL breaking out, or are you seeing warning signs I'm missing? Drop your take in the comments – I genuinely want to know what other traders are seeing.
And hey, if this helped you think through the setup, share it with your trading crew. Let's figure this out together.
Stay sharp out there.
