Bitcoin’s Technical Pulse: A Crucial Crossroads at $111,709
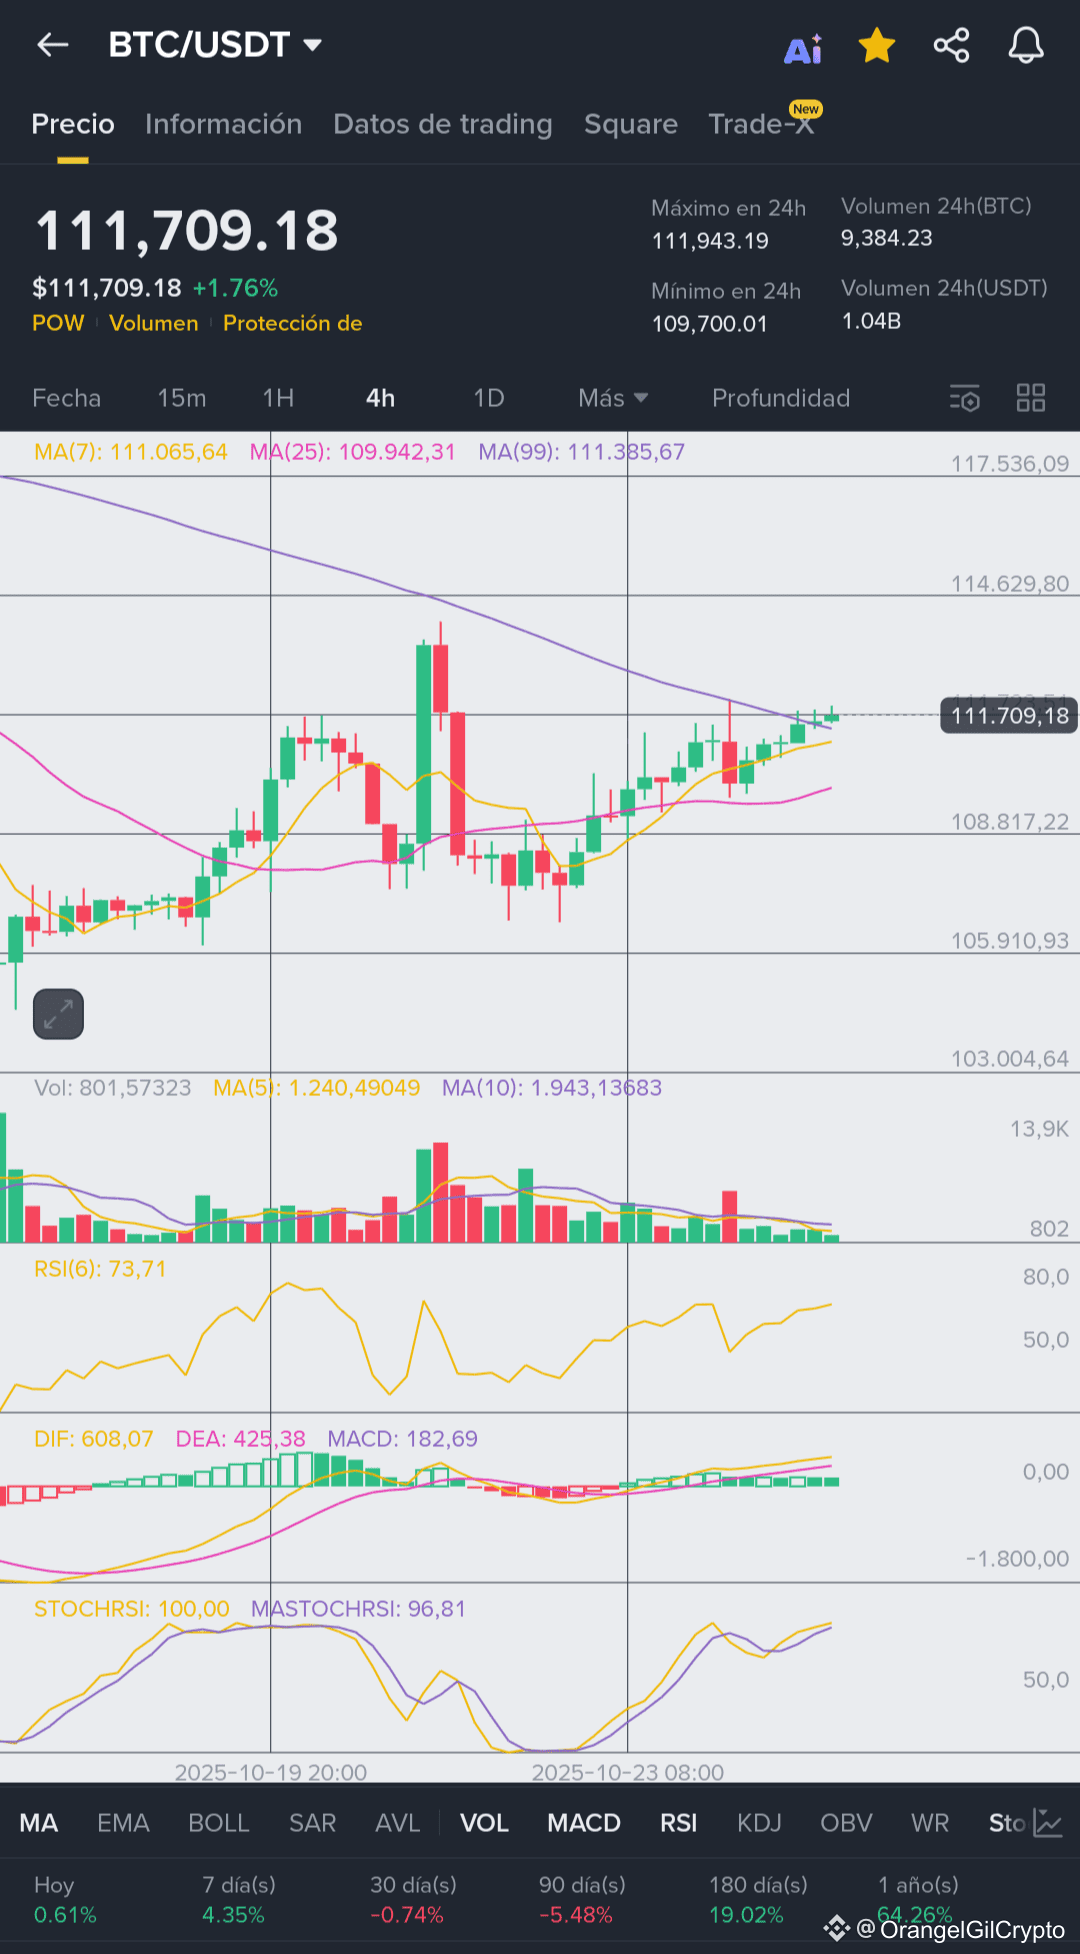
At press time, Bitcoin (BTC/USDT) trades at $111,709.18, marking a 1.76% intraday increase, with a 24-hour high of $111,943.19 and a low of $109,700.01. Market volume remains robust, exceeding 9,384 BTC traded within the last 24 hours, according to Binance Market Data.
This latest rebound places Bitcoin at a critical resistance zone, as the asset consolidates just below its 99-period moving average (MA99) at $111,385, while maintaining support above the 25-period MA (MA25) near $109,942. The convergence of these levels indicates tightening volatility and the potential formation of a bullish continuation pattern.
Indicators Signal Building Strength, but Momentum Nears Overextension
The Relative Strength Index (RSI) currently sits at 73.7, suggesting Bitcoin is approaching overbought conditions. However, the MACD histogram remains in positive territory (182.69) with the DIF (608.07) comfortably above the DEA (425.38) — a clear sign that bullish momentum is still dominant.
Meanwhile, the Stochastic RSI at 96.81 and MASTOCHRSI at 100.00 show that BTC could soon face a short-term cooling phase if buying pressure exhausts. As crypto trader and market technician Peter Brandt often reminds, “Markets that look strongest are often the most vulnerable to correction — but only temporarily, before trend continuation.”
Price Behavior and Market Structure
The 4-hour chart indicates a textbook ascending channel, reflecting higher lows since mid-October. Volume analysis suggests accumulation rather than speculative spikes — a behavior consistent with institutional layering. The 50-period moving average (MA50 at approximately $108,800) provides a robust support base, while the 117,500 level remains a major short-term resistance.
If Bitcoin successfully closes above $112,000, it could confirm a breakout above resistance, potentially targeting $114,600 and $117,500 in the coming sessions. Conversely, failure to sustain momentum may trigger a retracement toward $108,800, or even $105,900 — levels that would likely attract renewed institutional bids.
Market Sentiment and Global Context
According to Glassnode Analytics, long-term holders continue to accumulate, reducing exchange reserves to multi-year lows. Meanwhile, on-chain inflows remain stable, indicating “healthy conviction and low speculative churn.”
CryptoQuant reports increased miner wallet outflows, which could temporarily apply mild selling pressure but are historically followed by medium-term price stabilization.
Macro analyst Raoul Pal from Real Vision observes that “Bitcoin remains the cleanest macro hedge — the deeper the fiscal and monetary uncertainty, the stronger BTC’s reflexive bid.” With ongoing debates over U.S. debt sustainability and global liquidity tightening, Bitcoin’s narrative as digital collateral gains renewed strength.
Future Projections: Calculated Optimism
The probability of a bullish breakout remains above 65%, given converging averages and rising on-chain inflows. Yet, traders should remain cautious of profit-taking cycles as RSI nears exhaustion levels.
If BTC maintains momentum above $111K and reclaims $114K, the next major psychological target is $120,000, followed by a potential mid-term extension toward $128,000–130,000 — levels last seen during aggressive institutional accumulation phases.
However, should global macro indicators tighten further (e.g., higher U.S. yields or stronger DXY), Bitcoin could revisit the $105K–$107K liquidity zone before resuming its larger uptrend.
Strategic Technical Reflection
From a technical standpoint, Bitcoin’s setup illustrates controlled optimism within a maturing market phase. The convergence of institutional flows, high RSI, and macroeconomic triggers suggest that patience, rather than greed, is the key trading virtue at this level. Smart investors might employ scaled entries with clear stop-loss discipline below $108K, leveraging the trend — not chasing it.
Will Bitcoin’s push beyond $112K mark the beginning of a new macro bull phase?
