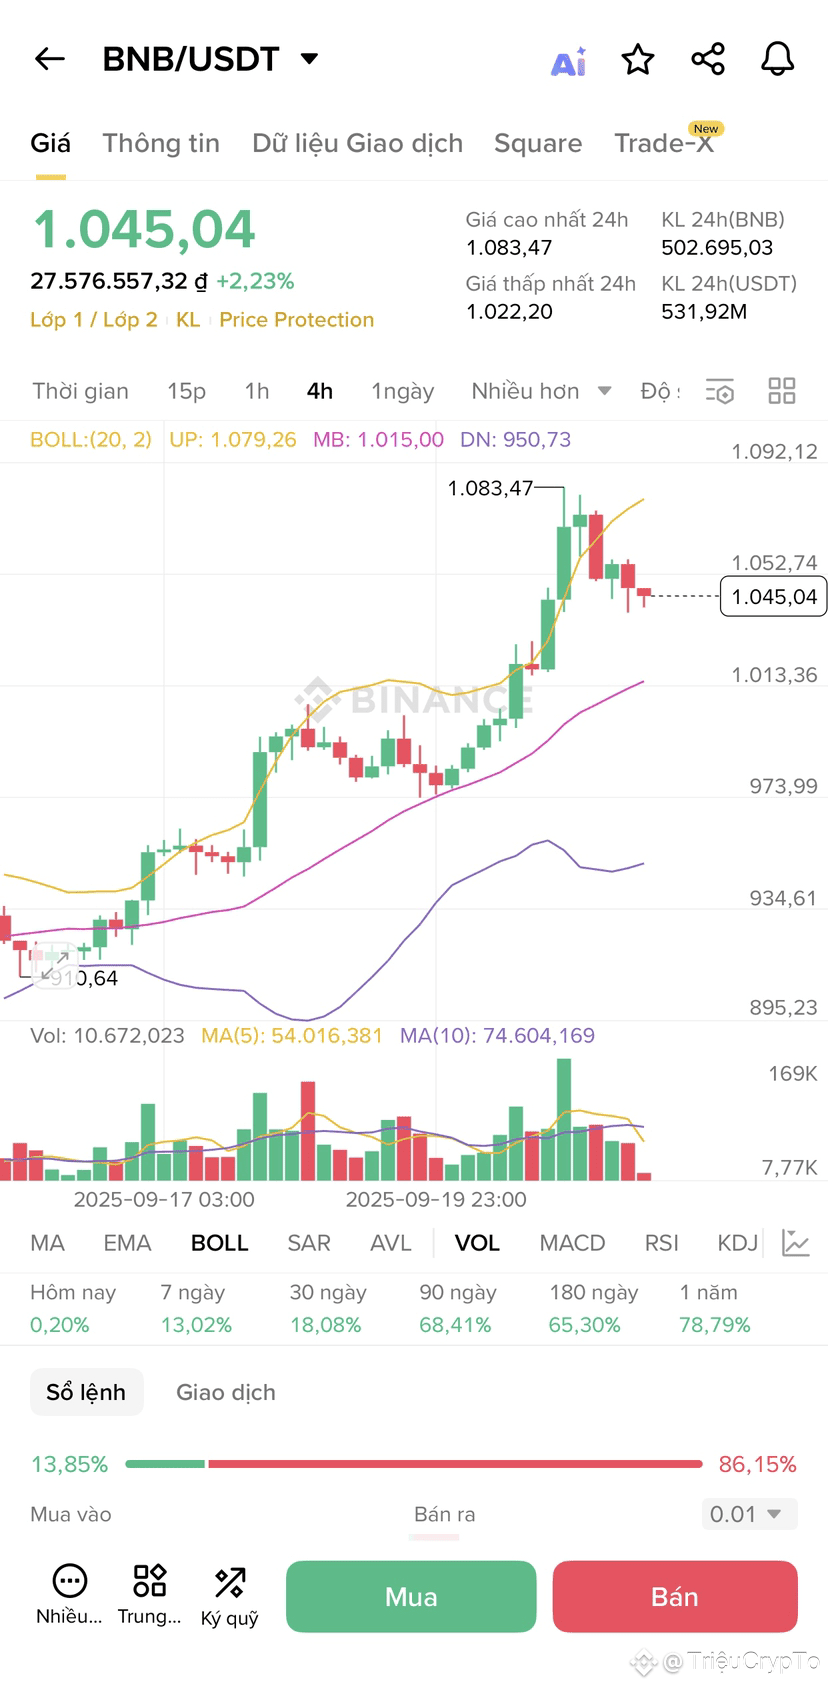
 Current Price: 1,045.04 USDT per $BNB
Key Price Levels (24h):
• Highest: 1,083.47 USDT
• Lowest: 1,022.20 USDT
Price Change:
• Up by 2.23% in the last 24 hours (27,576,557.32 KL)
Chart Analysis (1-hour timeframe selected):
• Uptrend: The chart shows a clear uptrend in the recent hours, with the price generally moving upwards. Green candles (bullish) are more prominent.
• Recent Correction/Consolidation: After reaching a peak around 1,083.47, the price appears to have pulled back slightly and is currently consolidating or experiencing a minor correction. The last few candles are red, indicating selling pressure.
• Moving Averages:
• There are two moving averages visible (likely MA(5) and MA(10) based on the labels below, though their exact position relative to the price might be clearer on a different scale). The shorter-term MA seems to be above the longer-term one, which is generally a bullish signal. The price is currently above both MAs, indicating strength.
• Bollinger Bands (BOLL - 20, 2):
• Upper Band (UP): 1,079.26
• Middle Band (MB): 1,015.00
• Lower Band (DN): 950.73
• The price has recently touched or even exceeded the upper Bollinger Band, which can sometimes indicate overbought conditions and a potential for a pullback. It is currently moving back towards the middle band. The middle band (1,015.00) could act as a support level.
• Volume: The volume bars at the bottom show increased trading activity, especially during significant price movements. There were notable green volume spikes during the uptrend.
Sentiment Indicators (from the bottom panel):
These indicators show performance over various timeframes, indicating a generally positive trend for BNB/USDT:
• Hôm nay (Today): 0.20% (Positive)
• 7 ngày (7 days): 13.02% (Strongly Positive)
• 30 ngày (30 days): 18.08% (Strongly Positive)
• 90 ngày (90 days): 68.41% (Very Strongly Positive)
• 180 ngày (180 days): 65.30% (Very Strongly Positive)
• 1 năm (1 year): 78.79% (Extremely Strongly Positive)
Overall Market Sentiment:
The overall sentiment for BNB/USDT appears to be strongly bullish over the medium to long term, as indicated by the impressive percentage gains across different timeframes. The recent 24-hour performance is also positive, despite the current slight pullback from the daily high.
Current Trading Signals (based on the price action and Bollinger Bands):
• The price is currently above the middle Bollinger Band, suggesting continued bullish momentum, but the retreat from the upper band indicates some short-term profit-taking or consolidation.
• The market seems to be in a strong uptrend but is currently experiencing a minor correction or retest of support levels.
Trading Actions (MUA/BÁN):
The interface shows "Mua" (Buy) and "Bán" (Sell) options, with current order percentages:
• Mua: 13.85%
• Bán: 86.15% (This might indicate that more people are currently looking to sell at this exact moment, perhaps taking profits, or it could be a display related to order book depth rather than overall market sentiment.)
Conclusion:
BNB/USDT is in a strong overall uptrend. While it has experienced a minor pullback from its recent high, the long-term indicators remain very bullish. Traders should monitor the price action around the middle Bollinger Band (1,015.00) and moving averages for potential support. Further upward movement would likely target the previous high and beyond, while a break below key support could indicate a deeper correction.