Chainlink (LINK) is currently experiencing a price dip, trading at $22.17, a 2.87% drop from yesterday. The token has been volatile, ranging between $22.06 and $23.18 over the past 24 hours. This downturn is attributed to a mix of profit-taking from a recent rally and a failure to sustain price above the key resistance level of $23.
Price Analysis and Technical Indicators
Following a recent rejection at the $24.85 mark, Chainlink's price fell below the crucial $23.00 support level, triggering a wave of selling. Technical indicators are now showing a bearish trend. The MACD histogram is negative at -0.49, confirming the downtrend, and the price is trading below its 30-day Simple Moving Average (SMA) of $23.47. The 38.2% Fibonacci retracement level at $23.48 is now acting as immediate resistance.
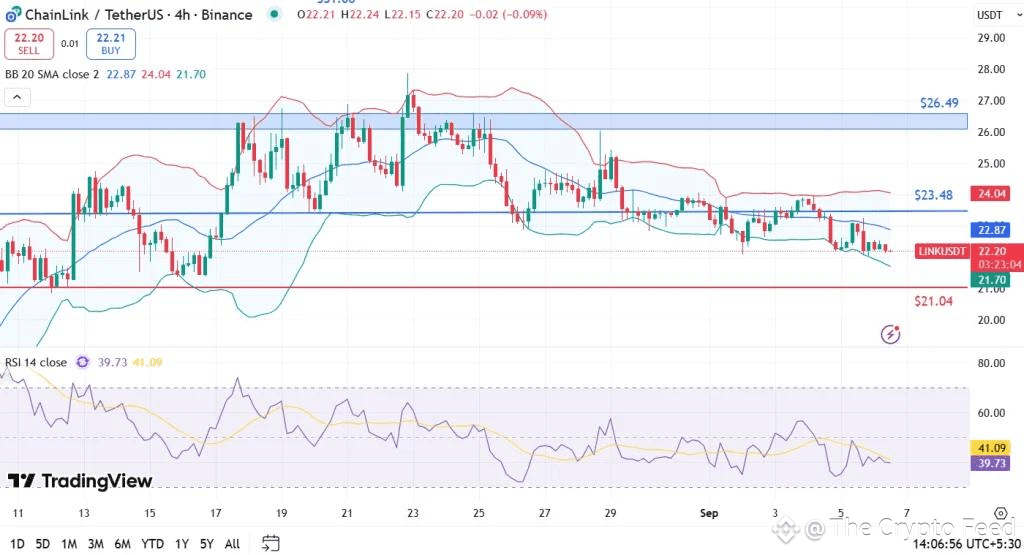
The Bollinger Bands show narrowing volatility, suggesting a sharp move is on the horizon. If the selling pressure continues, the next major support level to watch is at $21.04. However, if buyers can reclaim the $23.48 level, it could ease the downtrend and potentially pave the way for a rebound.
Positive Fundamental News
Despite the recent price struggle, Chainlink's fundamentals remain strong. The Chainlink Reserve recently added over 43,937 LINK, boosting its total holdings to 237,014 LINK. This accumulation signals a commitment to the network's long-term sustainability.
Even more significant is the new integration with the U.S. Bureau of Economic Analysis (BEA) to bring core U.S. macroeconomic data on-chain. This partnership with a major government agency underscores Chainlink's growing role as a vital bridge between traditional finance and blockchain ecosystems.#LINKUSDT
