
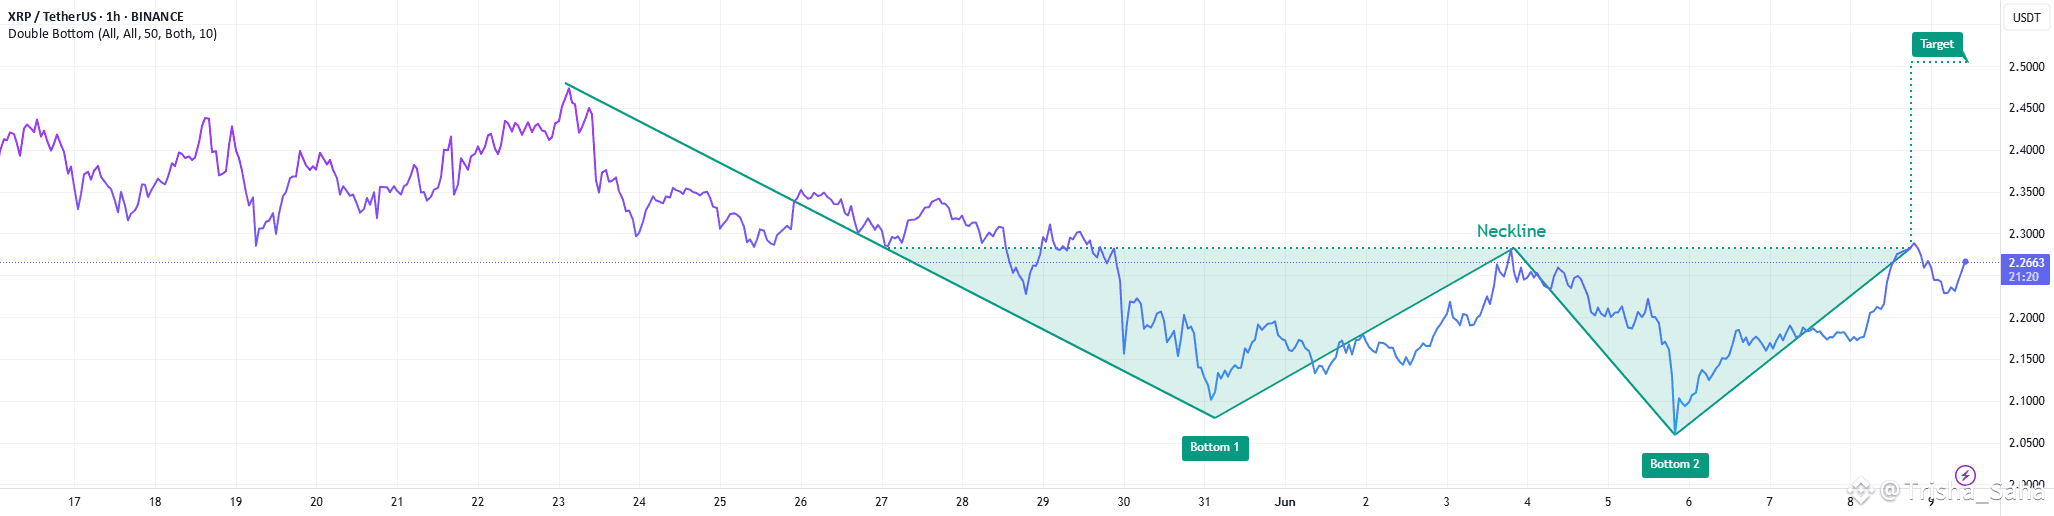
The classic double‑bottom breakout appears to be unfolding between ~$2.06–2.10, confirmed when price broke above the neckline at ~$2.28.
Traditional analysis suggests measuring the distance from the bottoms to the neckline, and projecting this upward, setting a breakout target near $2.50
Key Levels to Monitor
Support zone: $2.06–2.10 — must hold above this area to keep the bullish structure intact
Near-term resistance: $2.28 – recent neckline sit here
Next resistance levels: $2.50, $2.65–2.70, and even $3.00 if momentum supports it
Volume & Confirmation
Confirmation of this breakout should come with increased volume. The current volume has been relatively subdued, indicating possible weakening momentum.
A clean breakout above $2.28 accompanied by a volume spike and bullish candlestick (e.g., engulfing pattern) would solidify the breakout.
Invalidation
A drop below $2.06–2.10 would break the double‑bottom structure, opening the door to deeper support tests around $2.00 or even $1.70
Not financial advice.