
Meme coin SPX is today’s top gainer, surging nearly 10% over the past 24 hours and outperforming the broader market.
While most major assets have remained consolidated over the past week, the meme coin has continued to post fresh daily gains, capturing traders’ attention.
Capital Flows Into SPX as Meme Coin Readies for Golden Cross
The SPX token is on the verge of forming a golden cross, with its 50-day simple moving average (SMA) poised to break above the 200-day SMA.
 SPX Golden Cross. Source: TradingView
An asset’s 50-day SMA measures its average closing price over the past 50 days, smoothing short-term price fluctuations. When an asset’s price crosses above it, its value grows.
On the other hand, the 200-day SMA measures the average price of an asset over the last 200 days. It is a long-term trend indicator, and when the price rallies above, it indicates a long-term uptrend.
A golden cross emerges when the 50-day SMA crosses the 200-day SMA. This crossover is a bullish sign confirming a shift from a downtrend to an uptrend. It suggests that the asset’s price will rise, and traders often interpret it as a signal to go long.
If buying pressure persists and the SPX succeeds in forming the golden cross, it could be a catalyst that pushes it to multi-month highs.
Moreover, the Chaikin Money Flow (CMF) indicator suggests that SPX’s double-digit price surge is backed by buying pressure. As of this writing, the CMF stands at 0.01, having just crossed above the neutral zero line, a sign that accumulation now significantly outweighs selling activity.
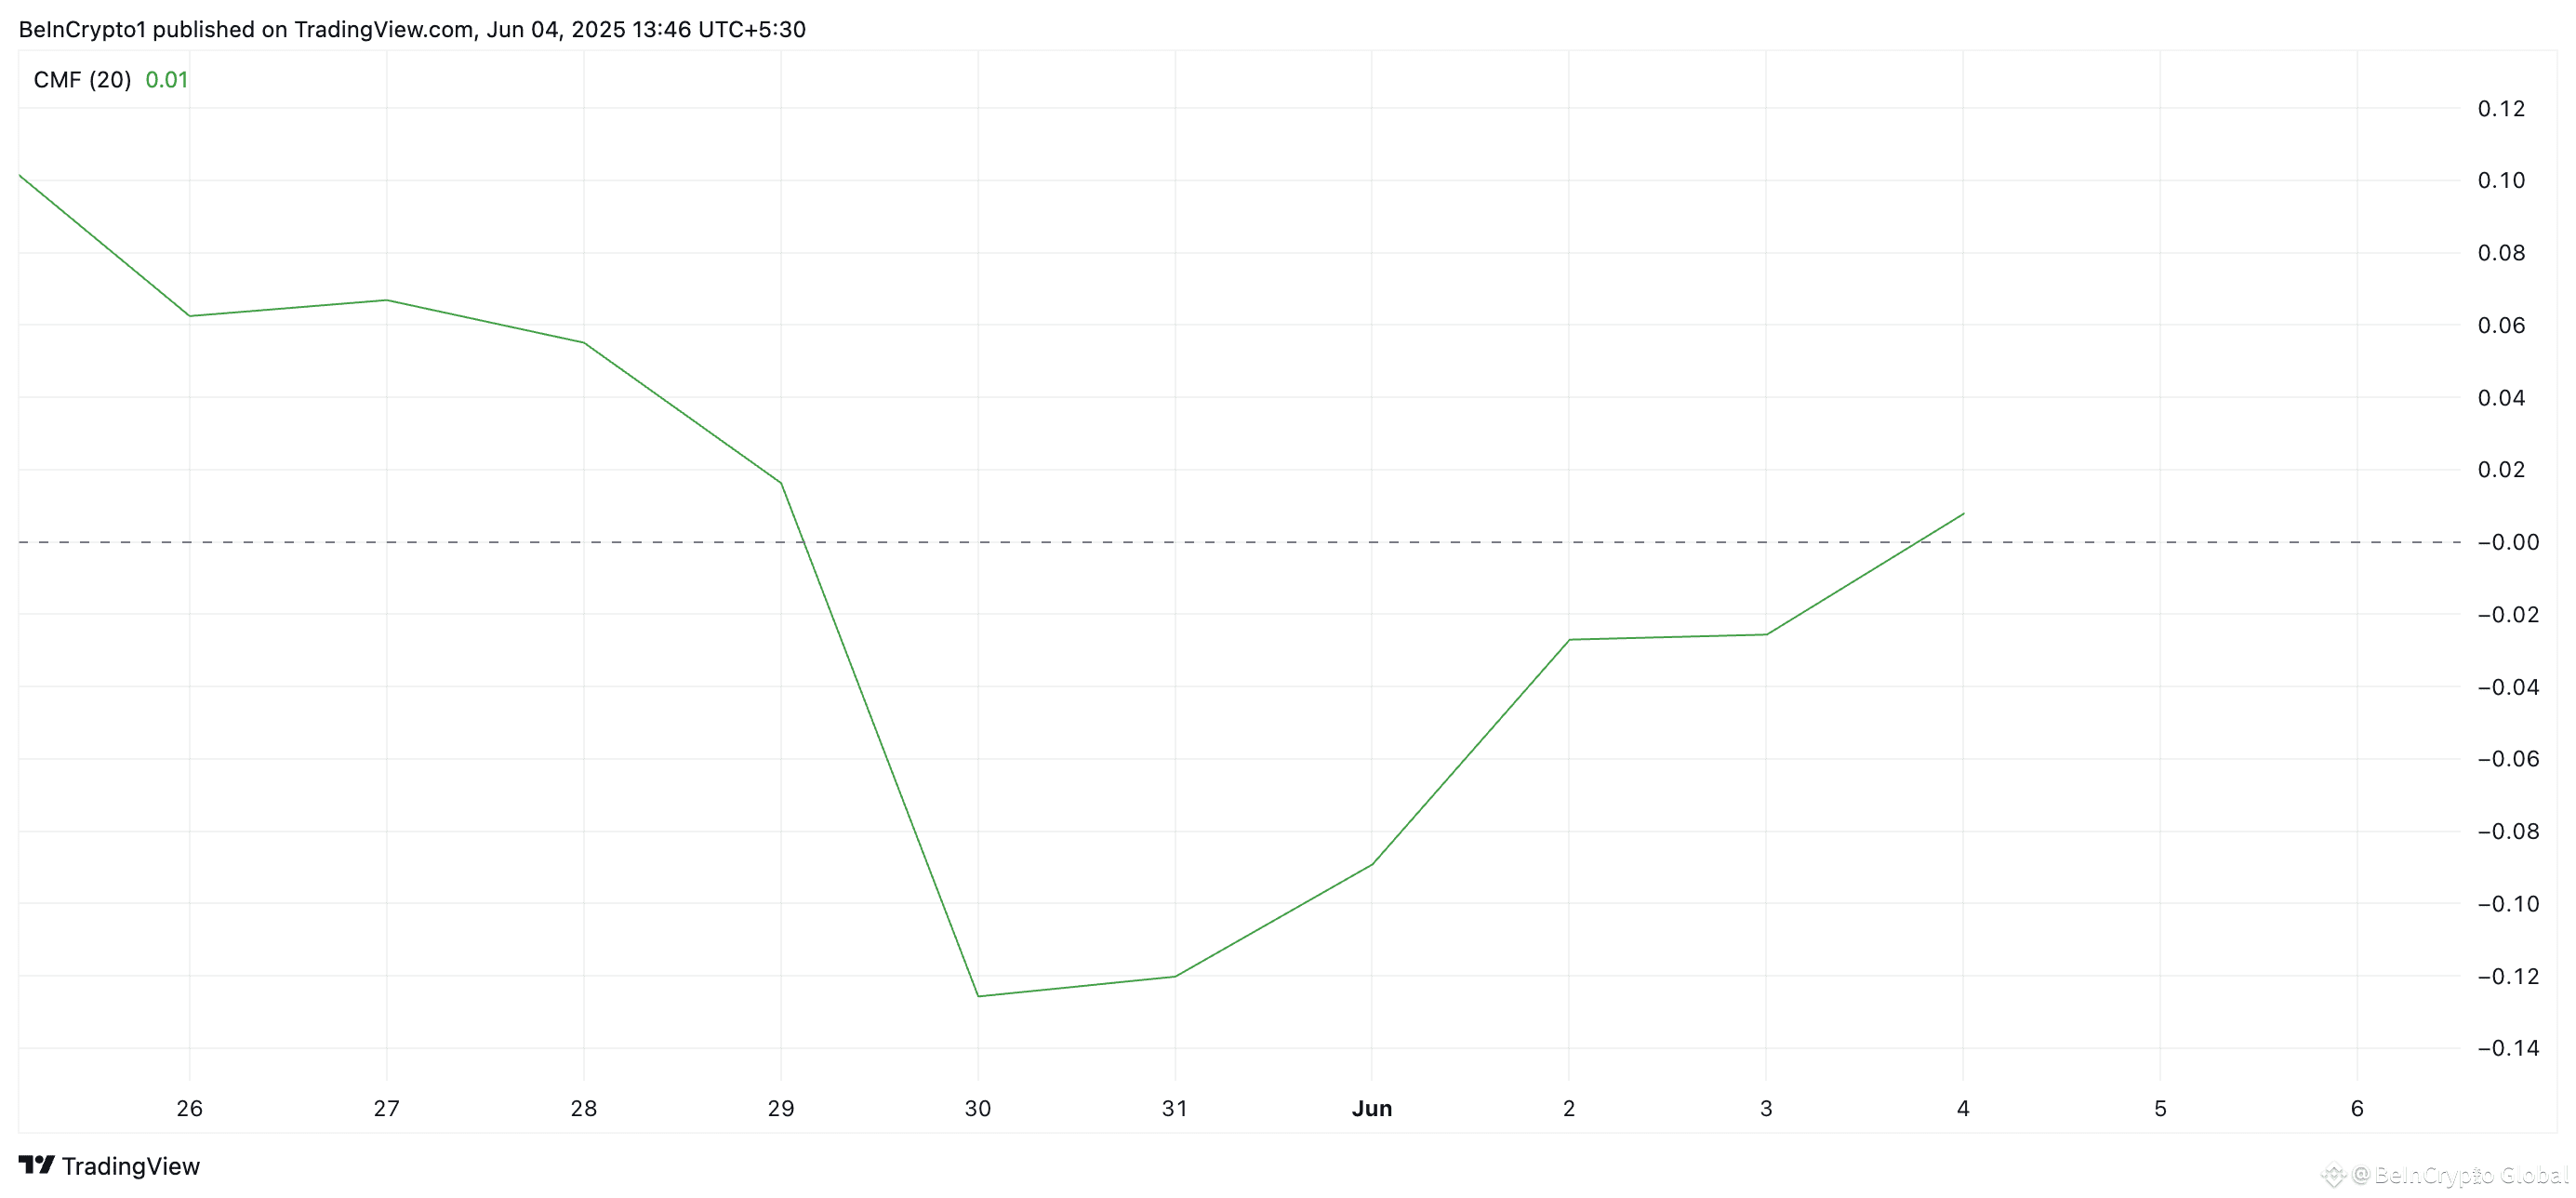 SPX CMF. Source: TradingView
This indicates capital inflow in SPZ and reinforces the support behind its price rally.
SPX Maintains Bullish Momentum
An assessment of the SPX/USD one-day chart shows that the altcoin trades significantly above its 20-day exponential moving average (EMA). Currently at $0.70, this key moving average forms a dynamic support level below SPX’s price, preventing it from any significant price dips.
The 20-day EMA measures an asset’s average price over the past 20 trading days, giving weight to recent prices. When an asset trades above it, it indicates short-term bullish momentum and suggests the price is trending upward.
If this continues, SPX could break above the $1.19 resistance and climb toward $1.27.
 SPX Price Analysis. Source: TradingView
However, if demand stalls and selloffs resume, the SPX token could shed recent gains and fall to $1.06.

