Part II: Quantitative Analysis
As we all know, on-chain data is open and transparent, and we can use various on-chain data to make an objective assessment of Web3 projects. In this section, I will show how to construct and analyze this data to determine the development potential of the project.
What data indicators should we pay attention to from the three different fields of DeFi, Layer1/Layer2, and GameFi?
DeFi
Decentralized finance (DeFi) applications include decentralized exchanges (such as Uniswap), lending platforms (such as Compound), and asset management companies (such as YFI).
Currently, DeFi has begun to reshape global finance and e-commerce, but this asset class is still full of mystery to many investors. 6 key indicators will show you how to analyze a DeFi project:
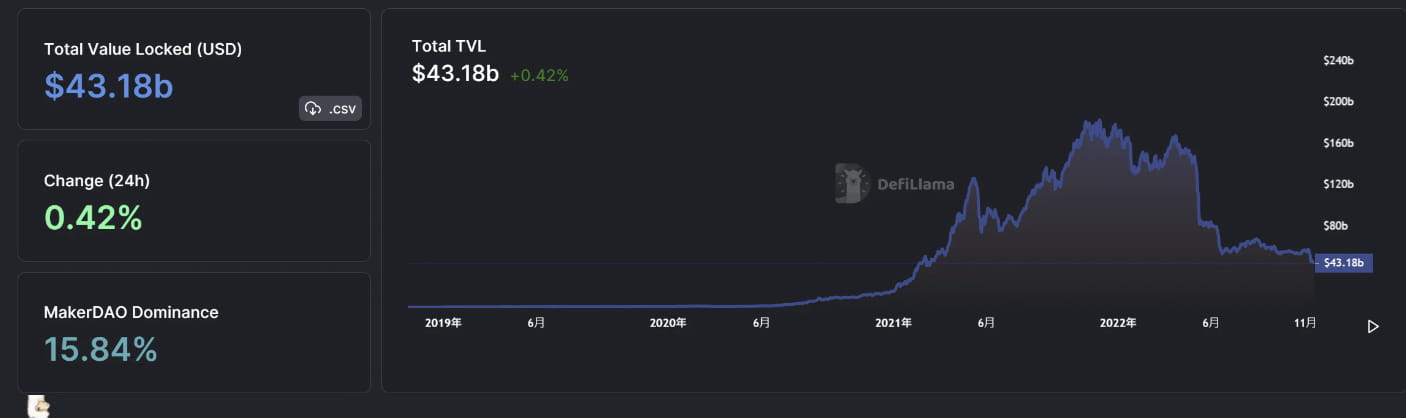
TVL
Total Value Locked (TVL) refers to the total value of assets that users have deposited and locked into the protocol. More assets locked in a project means that users are more confident in providing liquidity and collateral for the economic activities of the protocol. This shows the market's confidence in the project. Therefore, TVL is one of the most popular metrics in the cryptocurrency ecosystem and a common way for investors to compare target projects. As of now, the TVL of the entire DeFi is about $43.18b, and impressively, more than 16% of the TVL comes from the MakerDAO protocol.
TVL includes:
Staking
Lending
Liquidity pools
To find the TVL of a DeFi project, visit a site like DeFi Llama, which tracks DeFi projects and allows you to easily compare target protocols.
https://defillama.com/
Number of wallet addresses
The number of unique addresses indicates the number of cryptocurrency wallet addresses that exist in the DeFi protocol. Checking the number of unique addresses is a common strategy for investors. An increase in the number of unique addresses can indicate that more users are using the network and purchasing or using project tokens. Similarly, a decrease in the number of unique addresses may indicate that the project is losing market appeal.
However, this metric is manipulable. Users can easily create thousands of addresses and send funds from them, giving the illusion that unique addresses are widely used. Unique addresses should be used in comparison to other factors.
Project Market Value
Market capitalization is the most accurate overall reflection of a project's market value. The metric is calculated similarly to stocks in traditional stock markets, i.e. it is determined by multiplying the token price by the number of tokens in circulation. It is a popular metric in both the cryptocurrency and traditional finance sectors.
https://coinmarketcap.com/
On-chain data
In DeFi protocols on various public chains, operations such as asset exchange, transfer, lending, adding or removing liquidity are happening all the time. The data on the protocol chain can often reflect the market's capital flow, user sentiment, etc. in the first place, and is a very valuable analytical indicator.
Glassnode can provide comprehensive blockchain on-chain data, such as coin holding addresses within a certain range, exchange balances, and miner balances, but it requires membership and provides free on-chain analysis reports every week.
https://studio.glassnode.com/metrics?a=BTC&m=addresses.ActiveCount
Inflation rate
Is a low token supply a good sign? Not necessarily. Another important indicator to keep an eye on is the inflation rate. Just because the supply is currently low does not mean it will remain that way in the future, especially since new tokens are constantly being minted. One of Bitcoin’s distinguishing features is its declining inflation rate, which theoretically prevents existing units from devaluing in the future.
This is not to say that all systems need to emulate Bitcoin's scarcity. Inflation itself does not necessarily have a negative impact, but excessive inflation will dilute the value of funds. Its impact cannot be measured by a standard percentage, and it is best to take inflation into account when measuring other indicators.
Smart Money Holdings
Smart Money data on Nansen refers to cryptocurrency entities that are considered to be trading or investing in a sophisticated, well-informed or insider manner.
Smart Money records the smart operations of big funds and pioneers, and can monitor what Smart Money is buying.
https://www.nansen.ai/
Layer 1 & Layer 2:
Layer 1 refers to the underlying public chains such as Ethereum, Solana, Aptos, Avalanche and Flow. Layer 2 projects refer to extension layers that provide extensions to existing Layer 1, like Polygon.
We know that the "impossible triangle" of blockchain: decentralization, security and efficiency, also constrains all public chain projects. When developing, almost all public chain projects need to rank the importance of the three according to their own characteristics, or find a balance among the three, so that the developed public chain meets the needs of the market and establishes its own competitive advantage. Therefore, it is necessary for us to analyze public chain projects from these three points.
Decentralization
From the perspective of "decentralization", the lower the threshold for participation, the more people can participate in the consensus, and the more conducive to decentralization. Decentralization has many benefits for the entire public chain network, such as strong fault tolerance, not easy to be attacked, and data cannot be tampered with, which will attract more people to participate in the construction of the ecosystem, thereby enhancing the value of the public chain.
Stakers.info can monitor how many consensus nodes there are in each public chain. The more nodes there are, the stronger the decentralization.

safety
Blockchain is a database storage system that is distributed around the world and can work in a coordinated manner. Different from the operation of traditional databases, where read/write and permissions are controlled by a single company (centralized), blockchain believes that anyone who is capable of setting up a server node can participate.
Constrained by the impossible triangle of blockchain, while developing performance, security will be threatened. The security issues of public chains mainly include two aspects: 1. Nodes; 2. Smart contracts. If the number of nodes is insufficient and the degree of decentralization is insufficient, the network will be vulnerable to attacks. The security of smart contracts involves the bottom layer of blockchain, and it is necessary to consider aspects such as programming languages and virtual machines.
Therefore, we can measure the security of a blockchain in two ways:
1. How likely is a 51% attack? What are the chances that a single entity or organization will be able to control a majority of the hash rate?
2. Check the node validator rewards. High rewards can encourage miners and validators to actively maintain the security of the block.
efficiency
The size of the transactions per second (TPS) data can show the efficiency of a public chain project and whether its performance is high enough. A high-performance public chain can quickly process more transactions per unit time, thereby carrying more projects.
Additional technical indicators include:
Node processing requirements: The minimum CPU/computing resources needed to effectively run a node.
Transactions per second (TPS): The number of transactions processed and verified on the chain per second.
Chain Growth: The average growth rate of the longest chain.
Chain Quality: The proportion of honest blocks in the longest chain.
Time to Finality: The time from transaction submission to on-chain confirmation.
Number of nodes: The number of nodes participating in consensus, execution, or both.
Block size: The maximum amount of data a block is allowed to contain.
Number of developers and applications
Given that Layer 1 and Layer 2 projects are open source, anyone can build on top of them and integrate with them. The number of developers and the number of applications based on the protocol are probably the most important growth indicators for L1/L2 projects. Without developers, there are no applications. Without applications, there are no users. If a project has no users, it has no value.
Messari data shows that Polkadot and Cosmos are currently the second and third most active developer ecosystems among all public chains, with weekly code submissions and weekly active developers ranking among the top. Ethereum's developer ecosystem is still the most active among public chains.

Number of active wallets
Most L1/L2 projects have their own crypto wallets that allow users to buy, sell, trade, stake, and interact with decentralized applications (Dapps) built on their infrastructure. As is the case with DeFi, the number of daily active wallets (DAW) and monthly active wallets (MAW) is a key growth metric.
Play To Earn Gaming:
In 2021, the outbreak of Axie Infinity set off a wave of Play to Earn in the entire blockchain. GameFi once became the hottest sector in the blockchain industry, attracting a large number of users and venture capital institutions. With more and more blockchain games coming online, how should we judge the long-term value of a blockchain game? The following are three key indicators for evaluating the GameFi project.
Number of active players
The number of daily (or monthly) active users is a key indicator of game growth and popularity. From the on-chain data, the blockchain games that users played more in the past three months are Stepn, Bomb Crypto, and Arc8 by Gamee.
 Game threshold
Although rich game content is the key to success, it is also necessary to ensure that blockchain games have a low entry barrier. There are a large number of blockchain games on Ethereum, but the high gas fees and slow transaction speeds are discouraging many players. On the contrary, many old players have gathered on chains with lower transaction costs, such as WAX, Hive, and BSC.

Trading volume per capita
The average transaction volume per user refers to the average transaction volume per user in the game. It is one of the important indicators for analyzing the GameFi project, which reflects the user engagement, product and rationality of Tokenomics design. As an investor, you should pay attention to whether the trend of a project's average transaction volume per user is stable.
Summarize
The first part of my analysis is mainly based on qualitative data to evaluate cryptocurrencies and blockchain projects. It is more about understanding the background, team, products and vision of a project, and digging deep into the real value of these companies. After that, you can use the second part of the framework to use specific data to achieve the purpose of project analysis and comparison. I can't guarantee that every action you take in this bear market will be successful, just because you borrow these steps, find your own way to research Web3 projects, and put in a lot of effort, I promise you that the chances of investment success will definitely increase.


