
In on-chain data analysis, a basic concept is often used, namely realized value; it is calculated by valuing each UTXO at the price of BTC when it last moved on the chain.
Let's take a simple example:
Abao and Goudan traded cryptocurrencies together. Abao bought 2 BTC at the bottom of the last bull market at $3,000, so he now had a "realized value" of $6,000. When BTC rose to $60,000, he sold it to Goudan, and Goudan now had a "realized value" of $120,000. For Abao, he transferred the realized value to Goudan, and this was the first "wealth transfer" process.
Abao held the coins from 3,000 to 60,000 before selling them, which took 300 days, making him a "long-term holder (LTH)"; Goudan was unlucky. After buying at a high price, the market turned bearish. When BTC fell to 30,000, he had a breakdown and sold 2 BTC back to Abao without hesitation. He held the coins for 90 days, making him a "short-term holder (STH)"; at the same time, he also transferred the realized value of $60,000 to Abao, resulting in the second "wealth transfer".
In the first "wealth transfer", the "coin age" of BTC is 300 days, which we call "old coin". Once the "old coin" moves, the previously accumulated "coin age" is reset to zero and becomes "new coin"; in the second "wealth transfer", the "new coin" moves, and it is still a new coin and the "coin age" starts again until the next move. If Abao continues to hold the coin after buying it at 30,000 until now, then the "new coin" becomes the "old coin" again. In the whole process, the coin is still the same coin, but the "coin age" has changed.
I hope my statement is clear enough, because a clear understanding of the logic of wealth transfer between coins of different ages is extremely important for observing the changes in BTC cycles and trends!
Next, let’s look at the data:
The following figure is a waveform chart of the realized value changes of different coin ages. I have filtered the data and only include the realized value changes of LTH. Each color represents a coin age, and I have marked the corresponding "coin age" in black text on the waveforms of different colors.
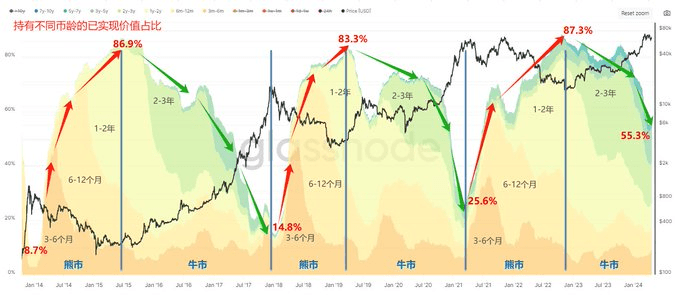
Through observation, we can find that from bull to bear, the realized value of old coins has a higher proportion (red arrow); for example, it increased from 8.7% to 86.9% in 2014-2015. From bear to bull, the realized market value of old coins has a lower proportion (green arrow). For example, it decreased from 86.9% to 14.8% in 2015-2018. Similarly, the same is true in the 2018-2021 cycle.
Look at the picture below, which only includes the realized value change of STH. I have also marked the corresponding "coin age" in black text on the waveforms of different colors.

It can be seen that the change in realized value of new coins is just the opposite of that of old coins. That is, from bull to bear, the realized market value ratio is getting lower (green arrow); from bear to bull, the realized value ratio is getting higher (red arrow).
This is the "wealth conversion" in the BTC cycle! Throughout history, the market has always followed this endogenous law and continued to develop, over and over again...
Now as the bull market enters the middle stage, the proportion of wealth in old coins has dropped to 55.3%, which is still a long way from the lows of 9-26% in the previous rounds. The proportion of wealth in new coins has increased to 44%, which is also a gap from the peaks of 74-85% in the previous rounds. The market's "wealth conversion" has not been completed, so I think the bull market cycle is not over yet!
But... this round is destined to be an "atypical" bull market. Whenever everyone is eagerly looking forward to it, if nothing unexpected happens, the "surprise" will come.
If we take out the realized value curves of 1d-1w and 1-2y coin ages separately and observe the progress of this cycle through wealth transfer visualization data, we can find that the pace of the bull market has been slowed down.

As shown in the figure above, the red line is the realized value curve of 1d-1w, and the blue line is the realized value curve of 1-2y. At the low point of the bear market, the "coin holding group (old coins)" occupies the main proportion of wealth, and the 1-2y curve reaches its cyclical peak. At the peak of the bull market, the "speculative group (new coins)" dominates the market supply, and the 1d-1w curve reaches its cyclical peak.
In each round of wealth conversion, there will be a specific "time point", that is, whenever the red line crosses the blue line, it means that the bull market is about to enter the main rising wave stage (as shown by the green arrow in the figure below).

In this cycle, the red line crossed the blue line on March 9, but crossed the blue line again on April 14, interrupting the upward trend unexpectedly. I think everyone knows the reasons for the interruption. Macro factors such as the postponement of the Fed's interest rate cut expectations, market concerns about the economic recession caused by maintaining high interest rates, and unexpected local conflicts in the Middle East are all driving forces behind it.
A similar situation also occurred in 2016. After the red line crossed the blue line for the first time in this cycle, it turned down on July 14 and did not cross again until November 8, a gap of 4 months, which means that the bull market process was delayed by 4 months. During this period, the price of BTC experienced a 17% correction.
We know that once the short-term trend changes, it will inevitably continue. Therefore, the main upward trend that everyone expects should not come so soon.
Although this period may not be "garbage time", it is definitely difficult to endure, and the possibility of a black swan causing a market correction cannot be ruled out. However, the market always follows its own logic and continues to move forward. Any "accident" can only slow down the pace of progress, but cannot change the general trend or direction. Getting ready to start again may be the best arrangement God has given us!
—— End of the second chapter ——
Next:
“Is the bull market over?” Series 3 — “Long-term holders” in the bull market
