The market is experiencing a slight correction after BTC reached a new all-time high. This correction is common before the Halving period, and Altcoins are the most affected.
However, this situation may represent a great opportunity for new investments or re-entries into certain assets.
An example is $XEC , which is currently at support on the weekly chart (1W). Furthermore, we observed that on the 4-hour (4H) chart the Relative Strength Index (RSI) indicator reached the oversold level (30), suggesting the possibility of a price base forming.


Another cryptocurrency is $TROY , which on the weekly chart (1W) is still trapped in a large descending wedge pattern, which has a higher probability of an upward breakout. On the 4-hour (4H) chart, we have also reached the RSI oversold level, which may indicate a temporary price base.


We also have $SXP , which on the weekly chart has remained at an Uptrend Line (LTA) and used the 12 and 26 period moving averages as support. Furthermore, on the 4-hour chart, it has also reached the RSI oversold level.


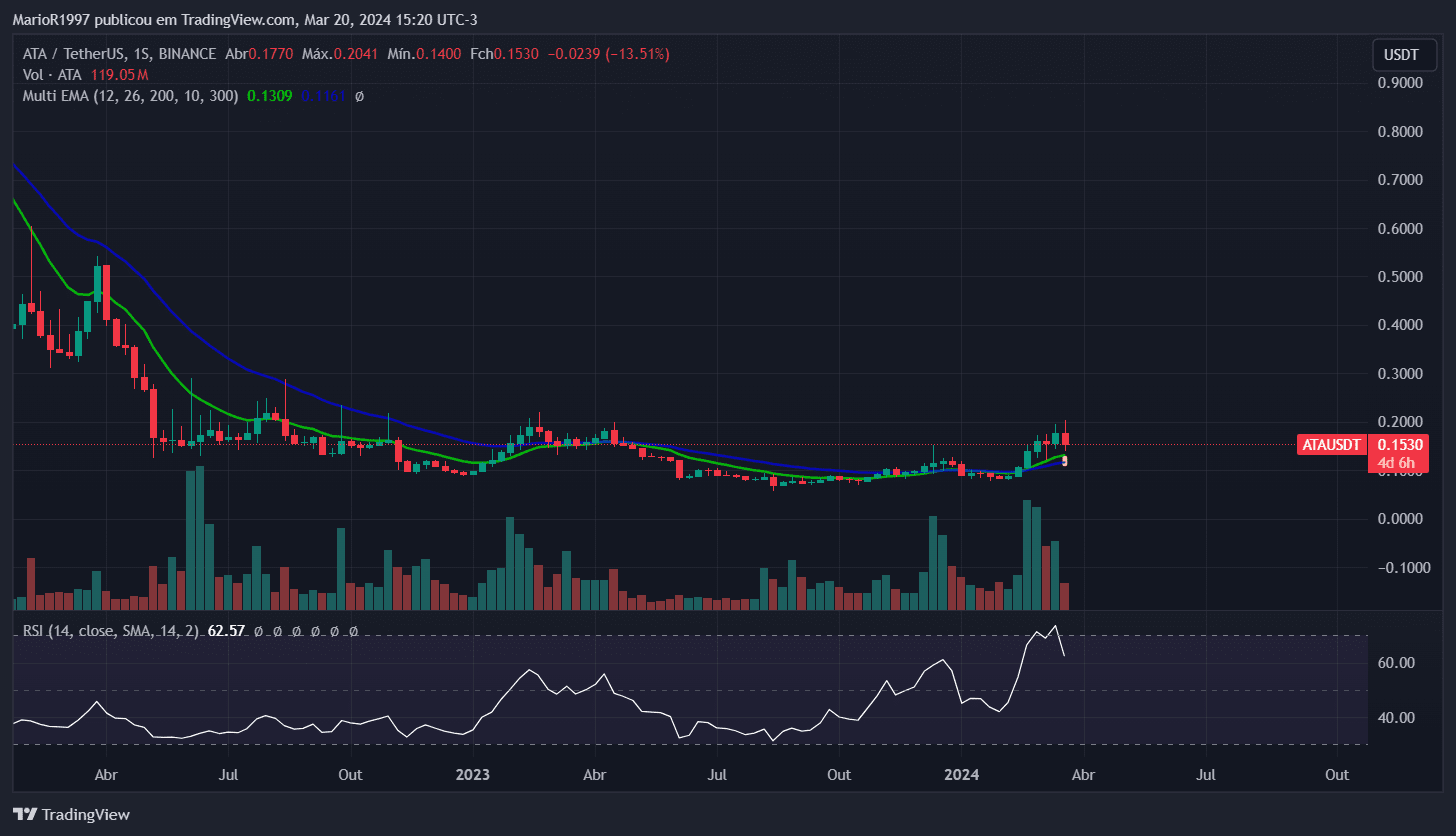
Continuing with the analysis, the ATA cryptocurrency demonstrates the formation of support on the weekly chart (1W), at the same time that the RSI indicator reaches oversold levels on the 4-hour chart (4H). Furthermore, it uses the 200-period moving average as support, and a reduction in sales volume is noted. These signs suggest the formation of a solid price base for this asset.

Similarly, BAL has formed support at the 12- and 26-period moving averages on the weekly chart, while the RSI reaches the oversold zone on the 4-hour chart.


CRV, in turn, which on the weekly chart (1W) is still trapped in a large falling wedge pattern, with the RSI at the oversold level on the 4-hour chart.


SUSHI, when analyzing the weekly chart, appears to be resilient in support of the 12-period moving average, with the RSI indicating oversold on the 4-hour chart, it still remains in a bullish trend.


Finally, IOST reveals a base of support on the weekly chart with the 26-period average, while RSI suggests oversold on the 4-hour chart.


These observations highlight potential entry or re-entry opportunities into the aforementioned assets, although it is essential to carry out further analysis and consider several factors before making any investment decision.


