Let's review why it is not recommended to chase shorts or look for head and shoulders bottoms when it first fell to around 26,000. First, the market definitely does not support chasing shorts when it breaks. The positions are increasing all the way down, but all the increases are new short positions. In this case, there is a high probability that it will not fall smoothly. Second, after looking around, the entire market was looking at the head and shoulders top and breaking the neckline. This position is where many people who follow the charts want to break. Third, let's go back to the chart. The low point of 26,500 is a long liquidity. This liquidity refers to the iconic low point, which is often the position of the upper long stop loss and the position of the short market price to open a position. This iconic low point is mostly the position where big funds like to open a position. In addition, the three waves abc that fell from 31,000, the one-to-one position of a and c is around 26,000. At that time, when the price fell rapidly and then pulled up, after closing the needle with a long lower shadow, it was likely to be the bottom.


Pay attention to the time points in the picture. In fact, the market has not changed. It is only your own mentality that has changed. In many cases, the rules are always there, but you just need to pay attention to them and discover them.


The first high point after the rebound also reminded us to pay attention to risks and not to chase longs in the pressure zone. We should wait for the pullback to confirm before going long again. Looking back now, the reminder was in place.

The same was true for last night's decline. It also reminded people not to chase the short position, but I don't know how many people listened to it.

Let's review last night's market. After falling to the previous low near 26600 last night, it tested twice, but did not continue to accelerate to test the callback range of 0.618-0.66. After a false break at a small level, it quickly rose and closed with a relatively perfect real positive K, which was another signal of bottoming out. And yesterday's market was the same. The price was going down, but the position did not decrease but increased, and CVD has been going down, which is another example of late shorts being punished. So naturally, when the price recovered the previous low, the late short stop loss formed an upward driving force. There was also a rapid climb last night. There are still a large part of the shorts here, which are those who are weak after the head and shoulders top broke through the neckline. So why don't you recommend looking at these market charts that most people can see, because they are too concentrated, which makes it difficult for these people to make money, and in the current market with only stock but no increment.


Next, I will pay more attention to several positions, 27650-27850, 28100-28400. The first position is the first high point since the rebound, as well as the untested OB area above and the possible 1.13 false breakthrough. The other range is the high point since this wave of decline, and it is the position where A and C of the three-stage rise of abc are 1:1. This kind of multi-factor resonance range generally has obvious support pressure, but it does not mean that you can go short or go long when it reaches it. You need to consider trading after the corresponding price pattern comes out. The two price ranges mentioned above are both pressure positions. If there is a corresponding downward price behavior, I may consider going short. If it breaks through smoothly, I will only hold the long orders in my hand. Wait for the market to change.

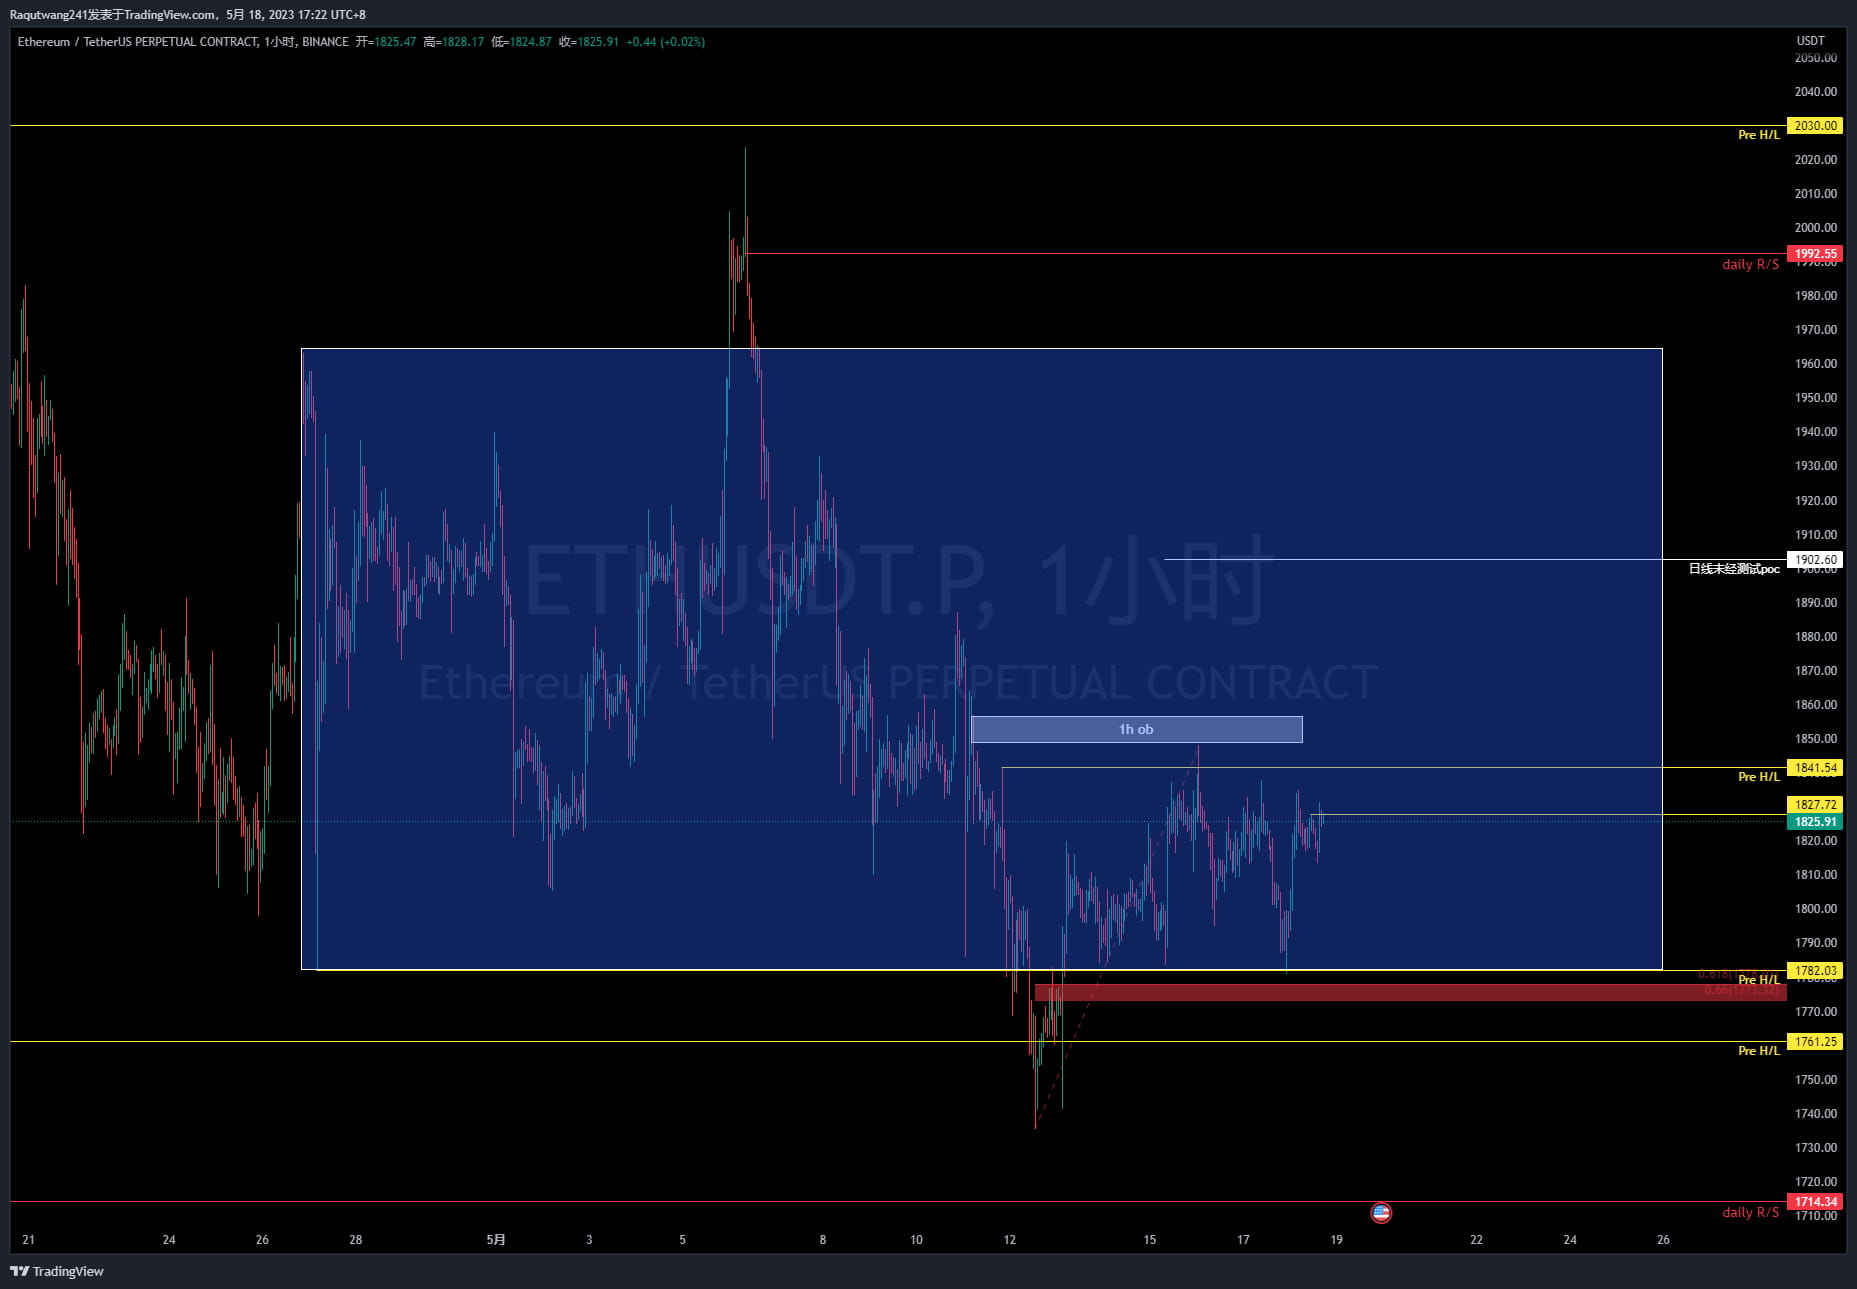
Shaobing actually moves more standardly than Dabing. After falling back to the lower edge of the range last night, it quickly rose. Pay attention to the three positions of 1850, 1885 and 1905. I will remind you when the time comes.
In addition, let's take a look at ES futures. It finally broke through last night. The market is the same as the big cake. Many people are looking at the diamond top again, but it turned out to be a piapia slap in the face. I will only pay attention to the true and false breakthrough of the 4210 position. This kind of price behavior that has been consolidating below the previous high is likely to reach it in the end, but whether it can form a real breakthrough is not yet possible to judge (PS: I personally think it would be best to touch this position and then fall back, then there may be a smoother decline, and drive the currency circle down).


There is also the US dollar index. After more than a month of testing, the 101.3 position mentioned a long time ago has finally started to rise. This is relatively bearish for all equity assets, but considering that the US debt ceiling is likely to be passed and a default is unlikely, I will pay more attention to the true or false breakthrough of the 103.5 position.
