Since 2024, the performance of Inscription Tokens ORDI and SATS has lagged behind the overall cryptocurrency market and shows signs of further decline. #sats #ORDI
In January, the entire cryptocurrency market experienced significant declines in multiple digital assets, including the most affected Inscription tokens (also known as BRC-20 tokens) ORDI and SATS.

The lackluster performance of these unique tokens is not only influenced by Bitcoin’s recent price volatility, but also by several other key factors.
Reduced need for inscriptions
It is worth noting that as of 2024, the prices of ORDI and SATS have experienced a decline of approximately 34.50% and 50%, respectively.

The main reason for this decline is that the entire cryptocurrency market, especially the Bitcoin market, has been permeated with a "sell the news" sentiment. As of January 25, ORDI's correlation coefficient with BTC reached 0.66, which has remained at a positive level in recent history.

In addition to this, this downward trend also coincides with a significant reduction in inscription fees and Bitcoin block size shares, highlighting the weakening demand for Bitcoin ordinal numbers.

The price trends of Inscription tokens are often closely correlated with BTC, mainly because the Bitcoin Ordinal is directly dependent on Bitcoin's blockchain. For example, ORDI's operations involve writing data directly to the Bitcoin blockchain, creating a unique form of digital artifact that exists in the output of Bitcoin transactions.
Technical conditions
Aside from the broader market trends, a key factor behind the recent decline in ORDI and SATS prices is the emergence of a bearish divergence signal.
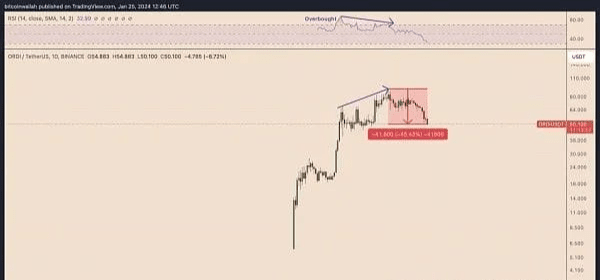
Taking ORDI as an example, its daily chart with USDT shows a typical bearish divergence pattern from December 5, 2023 to January 2, 2024. In simple terms, ORDI's price has formed higher highs, but its relative strength index (RSI) has shown signs of turning lower.

The subsequent 45% retracement was consistent with a bearish divergence signal, where the divergence between the RSI and price action preceded a correction in price.
Likewise, for SATS, its price experienced a bearish divergence signal of rising price and falling RSI during an uptrend, which resulted in a decline of more than 60%.
Overall, the bearish divergence on both the ORDI and SATS charts is worth watching for traders as it suggests a potential trend reversal, or at least a temporary interruption to the current uptrend.
ORDI and SATS price analysis
From a technical perspective, ORDI could have more room to fall in the days and weeks ahead.
Notably, the cryptocurrency has been experiencing an ascending triangle reversal breakout. This refers to a situation where an ascending triangle pattern fails to serve as a continuation pattern and instead results in a trend reversal.
By February, ORDI's breakdown target was approximately $38.50, which was derived after calculating the maximum distance between the triangle's upper and lower trendlines and subtracting the result from the breakdown point, as shown in the chart.

Interestingly, the $38.50 target coincides with the .618 Fibonacci Retracement level.
On the other hand, SATS has fallen to the resistance-turned-support level of $0.00000036. Meanwhile, its RSI has fallen below 30, which is an oversold zone. Both indicators suggest that it could rebound to $0.00000043 by February.
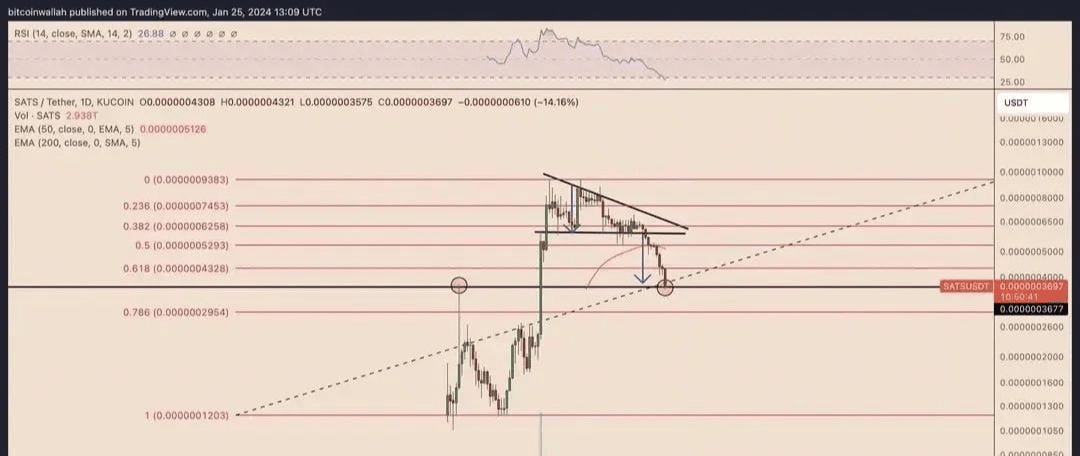
Conversely, a break below the $0.00000036 support could drop the price of SATS to the 0.786 Fibonacci level at $0.0000029.


