Most people who just enter the cryptocurrency world are in the secondary market
Both major strategies in the secondary market must be understood deeply: spot and contract
If you have a small amount of funds, or if losing it does not matter to you, like ten thousand yuan, which is about 1500U when converted, it is recommended to take out 100U from that and put it into the contract account, then only open a position with 10% each time, with a leverage of 50-100 times, and do it one position at a time.
If you have no understanding of trading, you can first use this 100U based on your feelings, whether you lose or earn depends on luck; this 100U is just to help you feel how worthless money can be.
After losing this 100U, you need to start learning technical analysis
Any type of technical analysis can be used, or any indicator, even naked candlesticks can be used. Learn while observing the historical candlestick charts of the assets you are trading to assess the success rate of the techniques you have learned.
Once you feel you have a deeper understanding of candlesticks and indicators, switch to 100U based on your learning outcomes to guide your trading.
At this time, you still have a mix of profits and losses. In most cases, you may not be able to strictly execute the learned content. Regardless, you will soon lose all of that 100U.
Next, you need to start learning trading psychology.
You need to refine your execution based on trading psychology, even using indicators and technical analysis to gauge market sentiment.
If your learning ability is sufficient and your execution power is strong enough, you should now be able to strictly implement the technical analysis methods you have learned.
Then switch to 100U. At this point, your chances of winning increase significantly, but after a while, you will still lose all of that 100U.
Next, you should learn some math knowledge.
The biggest difference between trading and gambling is that win rates and risk-reward ratios can be changed through subjective initiative.
Learning techniques, psychological analysis, and enhancing execution ability can improve win rates, but the secret to making big money in contracts lies in the risk-reward ratio.
For example, the lowest price of Ethereum in the last three days was 1976. The price rebounded multiple times to this level, so you seize the opportunity and reduce your position at 2020, with a stop-loss at 1940. The historical rebound high was 2103. If the trend goes well, it may even break through the resistance level and spike to 2200, giving you a potential risk-reward ratio exceeding 1:10, which is definitely a risk worth taking.
The premise of capturing the risk-reward ratio is to strictly implement stop-loss strategies.
Contracts are the best test of human nature and endurance.
Spot trading, with insufficient capital, what can be bought? If you invest 10,000, and a bull market comes, it can multiply tenfold. If time is limited, buy Bitcoin or Ethereum near the market bottom.
Newcomers to the cryptocurrency space often make common mistakes; this is pure content, take your time to read!
One, Contract Leverage.
1: Some newcomers still do not understand what contract leverage is and believe that 100x risk is necessarily higher than 1x. In fact, they are the same. For the trading platform I use, opening one position at 1x and another at 100x has the same floating profit and loss. The level of risk depends on your judgment of the trend and your entry point, as well as an important aspect: position management.
2: How to choose leverage? Personally, I prefer 100x leverage. For the trading platform I use, 100x can open more positions than 1x, meaning the proportion of margin is much smaller. If the trend is correct, and my entry point is not ideal, I can increase my position to turn losses into profits. Increasing my position is for better profit, not to increase my risk.
Two, Position Management and Average Cost.
As mentioned above, increasing the position is to achieve better profits, not to increase risk. Many newcomers may not know how to properly increase their position or by how much. I usually choose to increase my position at support and resistance levels. Instead of averaging down, I might add two or three times my position to achieve quick profits and reduce risks.
As for position management, I will share my own experience. I usually enter with a position of 25% or less. Regardless of the size of the trend, this is always the case. I never enter with 50% or 100% of my position. As for why, I believe everyone knows that entering with more means greater risk, closer to the liquidation price, and it is inevitable to encounter unfavorable points or situations where the market spikes. Therefore, this allows for better risk control.
Three, Take-Profit and Stop-Loss Anti-Resistance.
Those who can make money are not necessarily veterans; those who can stop losses are the true veterans. This is a statement understood by many, but few can accomplish. Newcomers to this should develop good habits of having stop-loss and take-profit. One should not be too greedy with profits to avoid turning profitable trades into losses. For example, if I am bullish this hour, I will go long near the support level. After making a profit, I will decide to exit part of the position and leave part to continue rolling. Once I find the trend is not right, and it can't break through the resistance level, I will exit entirely.
In terms of stop-loss, I personally view it as more important than take-profit. If the trend is wrong and you chase at the peak or trough, you must switch from long to short or vice versa. Remember to stop loss when it's time to do so. Do not resist the market; otherwise, if the market moves in one direction, the losses will keep increasing until liquidation. The stop-loss level should ideally be placed near support or resistance levels, taking into consideration market conditions and your risk tolerance to determine which cycle's support or resistance level is appropriate. In this circle, nothing is impossible; once you enter this circle, you should understand this. So, remember, be careful, money earned by luck will gradually be lost through skill.
Four, Support and Resistance Levels.
As mentioned earlier, support and resistance levels may be unfamiliar to many. A support level is a position where the price has repeatedly fallen but does not drop further, starting a rebound. A resistance level is a position where the price has repeatedly risen but cannot go higher, leading to a decline. So how should support and resistance levels be viewed? In fact, each cycle's support and resistance is different; by connecting the highest and lowest points, you can see them. The larger the cycle, the higher the reference value.
Five, Frequent Operations.
Many novice traders may experience this situation: frequently making trades, opening long positions and short positions in quick succession, often resulting in losses on both sides, or after deducting fees, ending up with nothing. This bad habit must be corrected. Remember, trading is not lacking in opportunities; there are opportunities every day, every moment. There is no need to rush to seize every opportunity; not all opportunities can be grabbed, nor can all opportunities be traded. It’s not about quantity but quality; controlling your hand well will prevent you from easily losing the money you’ve earned.
Six, Bottom Picking Principle: When a strong cryptocurrency continuously declines for 9 days at high levels, this is likely an excellent bottom-picking signal.
At this time, do not hesitate, act decisively. Such continuous declines often reveal genuine investment opportunities, which can be called golden pits. In the cryptocurrency space, significant corrections can sometimes present excellent opportunities to acquire low-priced assets. Seizing such opportunities lays the foundation for subsequent financial growth.
Seven, Take-Profit Rules: If the cryptocurrency held rises for two consecutive days, one must consider reducing positions to lock in profits.
The cryptocurrency market is unpredictable, and there are no myths of perpetual rises. Timely securing profits is the most practical approach. Avoid being greedy and missing the best take-profit timing, which leads to profit reversals.
Eight, Surge Signal: When a cryptocurrency shows a 7% increase, this is merely the beginning of the trend.
Generally, the next day, the cryptocurrency will continue to rise due to inertia. Therefore, investors must closely monitor the market and not rush to exit. Patiently wait for prices to rise further to achieve greater profits.
Nine, Trend Secrets: For those cryptocurrencies with long-term upward potential, the best entry point is when the pullback ends.
In cryptocurrency investing, it is crucial to reject blind chasing and killing of prices. Patiently wait for the market to adjust to the right levels, and enter based on the trend, just like waiting for the wind to come, making it easy to catch the express train of wealth growth.
Ten, Trend Change Warning: If a cryptocurrency price remains flat for three days, further observation is needed.
If horizontal consolidation lasts for six days without a breakout, investors should decisively choose to change positions and not cling to the battle. Long horizontal periods without breakouts often mean that the market may soon change, and timely adjustment of investment direction can effectively avoid risks.
Eleven, Stop-loss Iron Rule: If the purchased cryptocurrency does not recoup its cost the next day, it should be sold off immediately.
In cryptocurrency investing, stop-loss must be decisive and swift. Once an investment direction is found to be incorrect, it is necessary to cut losses quickly. Hesitation often leads to greater losses; strictly implementing stop-loss strategies is essential to preserve strength in the market.
Twelve, Continuous Rise Law: When a cryptocurrency rises for three consecutive days, it often indicates that a subsequent five-day upward trend may occur.
On the fifth day, investors should take profits. In the cryptocurrency space, knowing when to sell is the key to successful investing. Accurately seizing the right time to sell can maximize profits.
Thirteen, Volume-Price Bible: When a cryptocurrency shows a volume breakout at a low point, it is a clear entry signal.
An increase in trading volume indicates active market funds entering, and prices are expected to continue rising. Conversely, if there is a phenomenon of increased volume at high prices with stagnation, it is a strong warning to escape the top. At this time, investors should decisively exit to avoid falling into the trap of declining prices.
Fourteen, Moving Average Strategy: In technical analysis, the 3-day moving average can be used to judge short-term trends, the 30-day line can assist in observing medium-term trends, the 80-day line is often related to major upward waves, and the 120-day line can serve as a reference for long-term investments. Investors should choose cryptocurrencies with moving averages trending upward for investment, following the trend to achieve stable profits while avoiding fatigue and risks from frequent operations.
Fifteen, Counterattack Principles: Even with a small amount of capital, considerable profits can be achieved in the cryptocurrency space.
The key is to refuse the interference of FOMO (Fear of Missing Out) emotions and strictly adhere to trading discipline. Persistently learn and practice every day, allowing yourself to improve 1% in investment knowledge and skills, creating miracles of wealth growth through the power of compound interest.
Over the past two years, I have studied various chart patterns and summarized simple and replicable trading methods, conducting tens of thousands of trading practices. My cryptocurrency trading method is very simple and practical. I managed to trade to an eight-figure amount in just one year, only focusing on one pattern, entering the market only when I see an opportunity, and not taking trades without a pattern. I have maintained a win rate of over 90% for five years!
My wealth secret: The simplest and most foolish method for trading cryptocurrencies (trend trading method).
One: What is a trend:
Trends are the direction of market movement, either up, down, or sideways. Trends are the regular conclusions drawn from observing financial trading markets (such as stocks, futures, foreign exchange, and cryptocurrency markets), where changes in buy and sell decisions shape different forms of trends. Trends always run in the direction of the least market resistance; finding a trend is finding the direction of least resistance. Financial trading masters generally advocate that traders follow trends.
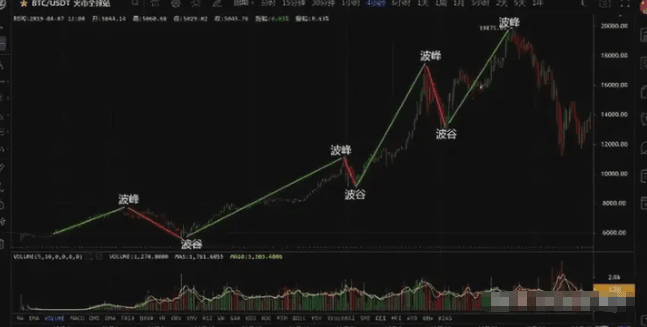
According to Dow's theory: Any trend will eventually run its course, meaning a bull market must be accompanied by a bear market, repeating cyclically. Market prices do not rise in a straight line in one direction; the trajectory of trend movements resembles waves that follow one another, with clear peaks and troughs.
Peaks and troughs are the basic elements that constitute different trends. Based on the positions of peaks and troughs, they can be classified as: upward trend, downward trend, and sideways trend.
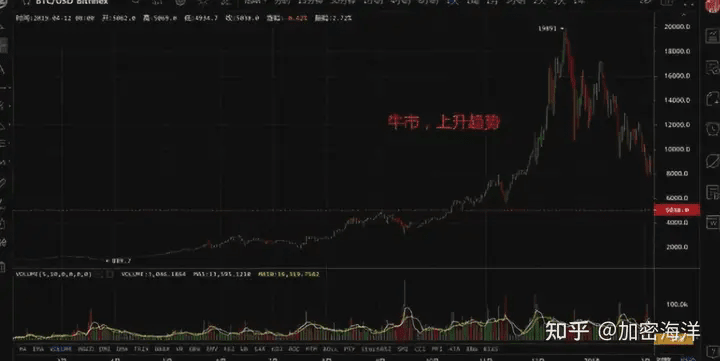
1. Upward trend:
Basis for judgment: peaks and troughs are gradually rising.
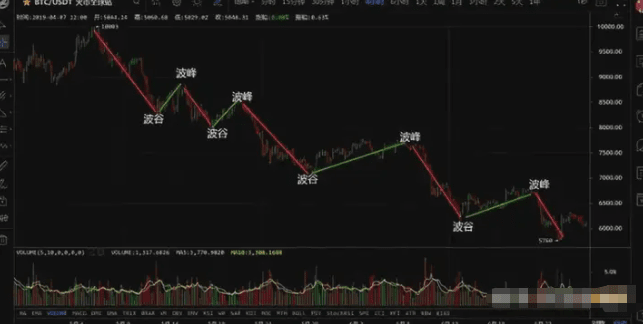
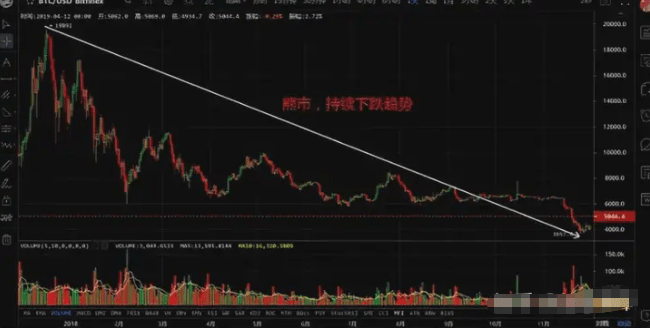
2. Downward trend:
Basis for judgment: both peaks and troughs are gradually lowering.
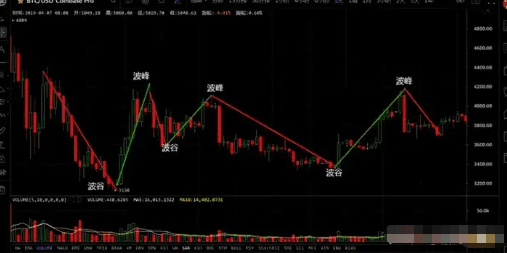
3. Sideways trends:
Basis for judgment: peaks do not rise regularly, and troughs do not fall regularly. Peaks and troughs do not have clear rising or falling patterns. Under special circumstances, peaks and troughs can be on the same horizontal line.
Two, Categories of Trends:
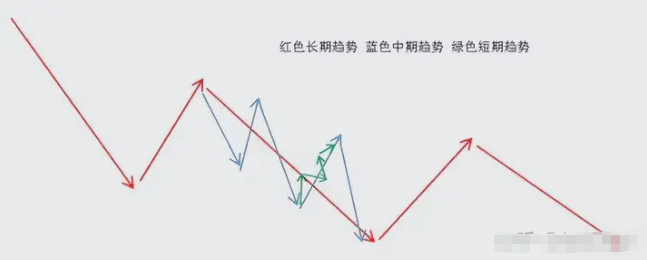
1. Depending on the time cycle, trends are usually divided into short-term trends, medium-term trends, and long-term trends.
Trends lasting a few days are referred to as short-term trends, and short-term trading mainly references cycles.
Trends lasting from several days to several weeks are considered medium-term trends, and medium-term operations mainly reference cycles.
Trends that last for several months to several years are long-term trends, and long-term trading mainly references cycles.
Multiple short-term trends form medium-term trends, and multiple medium-term trends form long-term trends. The terms bull market and bear market usually refer to long-term trends that last several months or years.
2. Types of trends: three types (Dow Theory): primary trend, secondary trend, and temporary trend.
① Primary trend: represents the overall basic trend, indicating the overall rise or fall of market prices, with the longest time span and the largest amplitude of price rise or fall. The formation of a primary trend often requires a longer time and more capital to battle. As long as the next rise exceeds the last high point, and the next drop is higher than the previous low point, the overall trend is upward, indicating a bull market. Conversely, if the overall trend is downward, it is called a bear market. Trends displayed over large cycles, such as daily or weekly charts, are more reliable and less likely to be manipulated by major players.
② Secondary trends: They exist within primary trends and play an adjustment role in market price fluctuations, also known as corrective trends.
If the primary trend is a bull market, the secondary trend is the downward pullbacks during the upward process. If the primary trend is a bear market, the secondary trend is the upward rebounds during the downward process. The adjustment amplitude of secondary trends is generally between one-third and one-half of the primary trend.
③ Temporary trends: These are fluctuations within a day or shorter cycles, which are components of secondary trends. Short-term fluctuations themselves have no significant meaning, so analyzing major trends based on short-term fluctuations can easily lead to erroneous conclusions. Temporary trends have short durations and can be manipulated, so ordinary investors are advised against trading them.
Major trends are composed of minor trends, and minor trends often comply with major trends. When a trend reverses, minor trends are more sensitive than major trends. In any market, these three types of trends must coexist. Any trend will eventually complete its course, meaning a bull market must be accompanied by a bear market, repeating cyclically.
Long-term traders are most concerned with primary trends: daily, weekly, monthly, etc. Short-term investors focus on secondary trends and short-term trends.
What type of investor you are determines what type of trend to use as a reference.
Three, How to draw trend lines:
Trend lines can intuitively show the trend direction. They are used to predict future market changes and to judge support and resistance. The support or resistance effect of trend lines will ultimately be broken, resulting in a change in price direction.
1. What is a trend line? 2. How to draw a trend line? 3. The role and precautions of trend lines.
Four, Conditions for Trend Reversal and Termination:
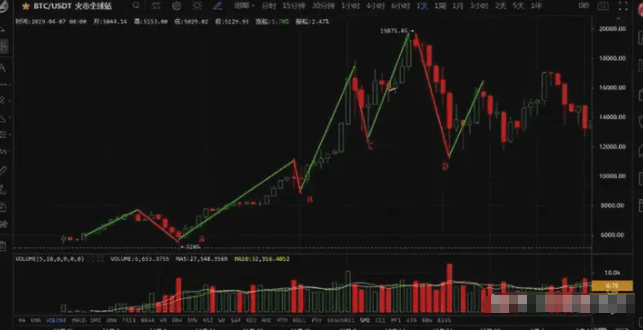
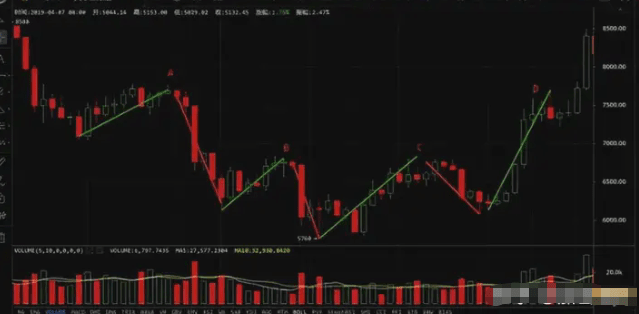
1. During the upward process, if the pullback low point is below the previous low point, the upward trend line ends. As shown at point D below point C.
2. In a downward trend, if the rebound high point is above the recent downward starting point, the downward trend ends. As shown:
Five, Judging Trends and Trend Following Trades:
Judging the trend divides into major trends and minor trends. Major trends indicate whether it is a bear or bull market, while minor trends indicate whether short-term prices are declining or rebounding. If the major trend has likely reached the bottom and is consolidating, the short-term trend may be in a small range of fluctuations, allowing for buying opportunities at support levels.
For example, if BTC's bottom is gradually rising and running above various moving averages, with all moving averages trending upward and multiple indicators suggesting an upward trend.
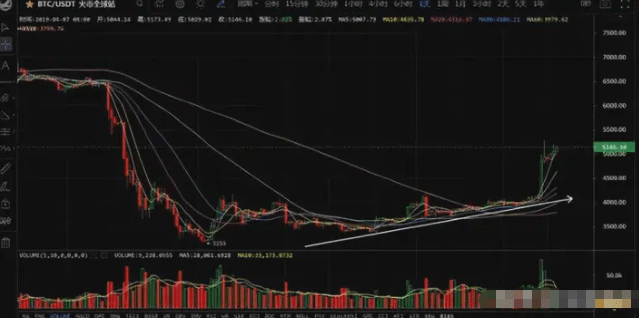
In addition to the above methods for analyzing and judging trends, one should also refer to candlesticks, volume, moving averages, and other technical indicators.
Other trend indicators include: MA moving averages, BOLL indicators, MACD, Fibonacci retracements, etc.
These are historical experiences left by the long evolution of financial markets, and they are successful historical experiences that embody knowledge of mathematics and psychology. Technical analysis is not about guessing or divining the future; it is a summary and prediction of changes in the trading market obtained through long-term statistical observation and verification by investment masters.
How to draw Bitcoin trend lines.
Drawing Bitcoin trend lines mainly includes the following steps:
1. Determine trend points.
Upward trend line: You need to find two consecutive declining high points to draw the upward trend line through these two points.
Downward trend line: You need to find two consecutive rising low points to draw the downward trend line through these two points.
2. Draw lines connecting the points.
Use a straight line to connect the selected two points to form a trend line. Ensure the line goes through most points as much as possible while avoiding excessive deviation from actual data.
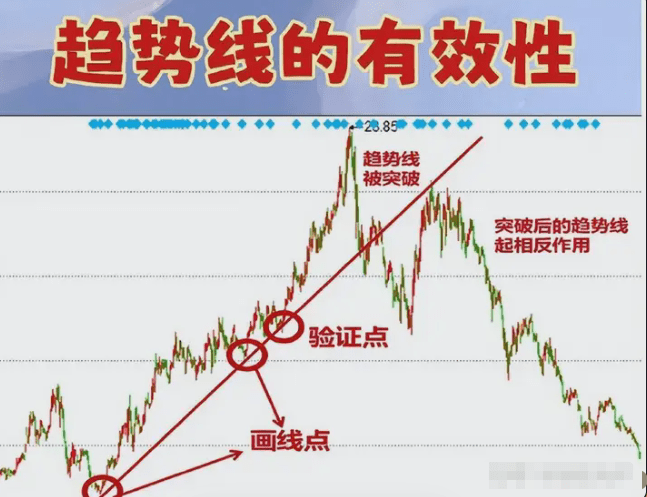
3. Validate trend lines.
After drawing the lines, observe whether market behavior aligns with the indications of the trend lines. Effective trend lines should serve as support or resistance in practical operations.
4. Correction and Adjustment.
If market activity indicates that the trend line is ineffective, it needs to be adjusted. It is generally recommended to use at least three clear points to determine the trend line to improve accuracy.
5. The significance of analysis.
Trend lines are mainly used to assist in analyzing market trends and possible turning points. Correct trend lines can help traders judge price movements and formulate trading strategies.
Through these steps, effective Bitcoin trend lines can be drawn, allowing for the use of these trend lines in technical analysis to predict market movements.
Everyone inevitably encounters support and resistance levels when first learning trading techniques.
The trading model based on support and resistance can be roughly divided into two categories:
(1) Reactive trading: Enter when the price tests the support and resistance for a rebound or reversal.
(2) Breakout trading: After the price breaks through support and resistance, enter to continue the trend.
Therefore, accurately judging support and resistance levels is crucial for trading profitability and is the most fundamental skill.
Today, I will explain the 8 most common and effective methods to determine support and resistance levels, which I believe will be very helpful for everyone.
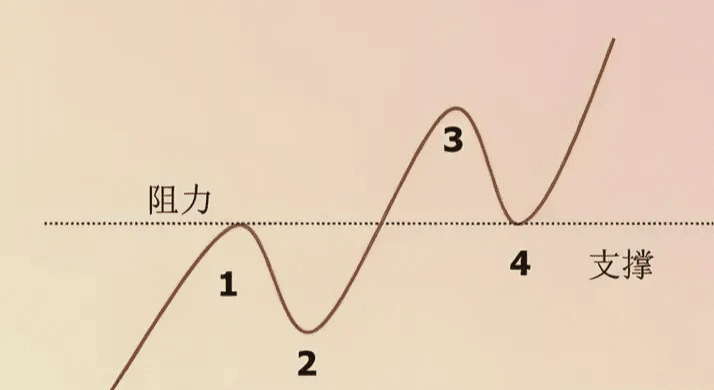
1. What are support and resistance levels?
(1) Support level: This refers to the price below the current price, where a price pullback encounters support, leading to a reversal from falling to rising.
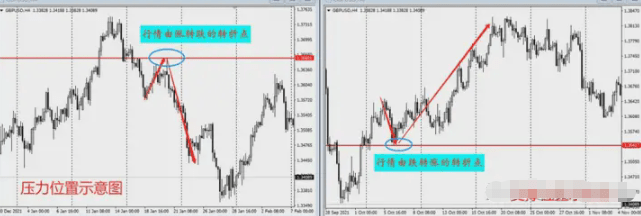
Look at the image below; this shows the reversal at the support and resistance levels of the market at high and low points.
(2) Resistance level: This refers to the price above the current price, where the price rises and encounters resistance, leading to a reversal from rising to falling.
Look at the image below; this is the continuation of the trend and the reversal of the pressure and support positions.
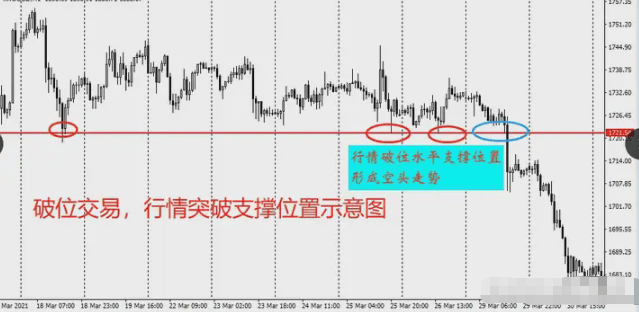
(3) Breakout points: In breakout trading, once the market breaks through support or resistance, the trend continues at the breakout point.
Look at the image below; this shows the market breaking through the support level, leading to a continuation of the trend after breaking.
Two, 8 methods to judge support and resistance.
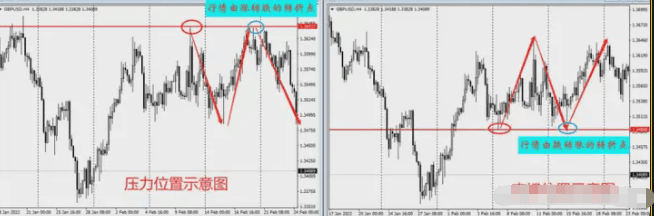
Method 1: Use previous highs and lows as support and resistance levels.
On the chart, the high and low points in front of the current price are the most common methods for judging support and resistance levels.
Look at the illustration below:
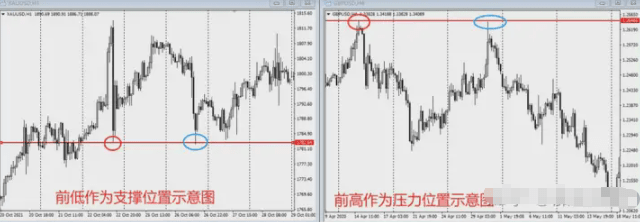
The left side of the chart shows the 1-hour candlestick of gold, where the price reversed upward after testing the previous low support.
The right side shows the GBP/USD 4-hour candlestick chart, where the market tests the previous high resistance upward and then reverses downward.
Points of Note:
(1) Select obvious previous highs and lows.
(2) Large-level previous highs and lows can be used for trading; do not use small levels for trading. For example, for a 1-hour trend, you can use 4-hour previous highs and lows as support and resistance, but do not use 15-minute or 5-minute previous highs and lows.
(3) Selecting previous highs and lows as support and resistance requires some subjective judgment from traders. Try to make judgments during halts or when not holding positions; at this time, traders are more calm and objective, making the identified support and resistance more effective. Once determined, do not change it casually.
Method 2: Key Prices (the support and resistance effects of integer price levels and significant historical prices).
(1) Integer levels in product pricing typically have support and resistance effects.
For example, U.S. crude oil priced at $100 per barrel, or the frequently mentioned Shanghai Composite Index at 3000 points.
Look at the illustration:
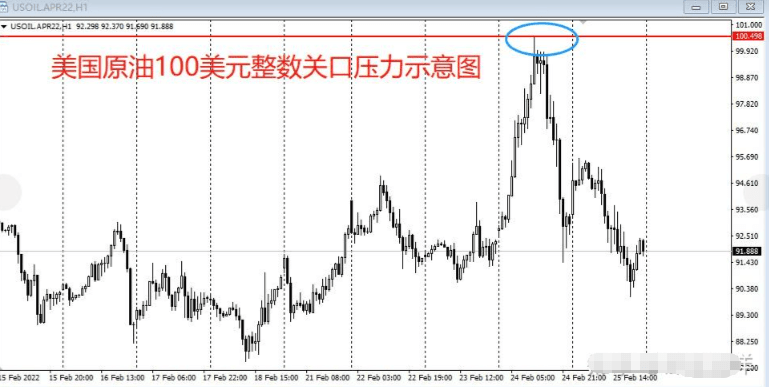
The chart shows last week's U.S. crude oil 1-hour candlestick chart, where the price peaked at 100.49, briefly breaking the 100-dollar integer level before consolidating and reversing downward.
(2) Significant historical prices.
In the price movements of a certain asset, there are particularly important prices that have support and resistance effects.
Look at the illustration below:
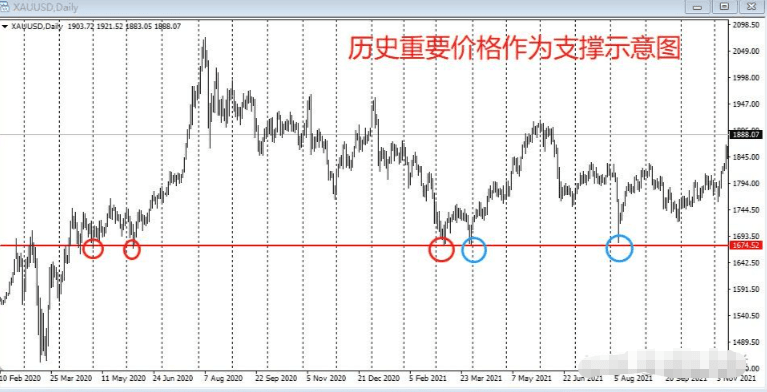
The chart shows the daily gold candlestick, which experienced a significant rise to a historical high of 2074 due to the pandemic, followed by a deep pullback to a low price of 1676, with the market repeatedly finding support at 1676.
Points of Note:
(1) Not all integers have support and resistance effects; only significant integers can be used.
(2) Trading opportunities at significant integer levels and important historical prices are not many, but once they appear, the success rate is relatively high.
Method 3: Using moving averages as standards for judging support and resistance.
Moving averages are the most commonly used technical indicators, used as support and resistance levels, and are one of the most common methods for using moving averages.
When the moving average is below the price, it acts as support.
When the moving average is above the price, it acts as resistance.
Look at the illustration below:
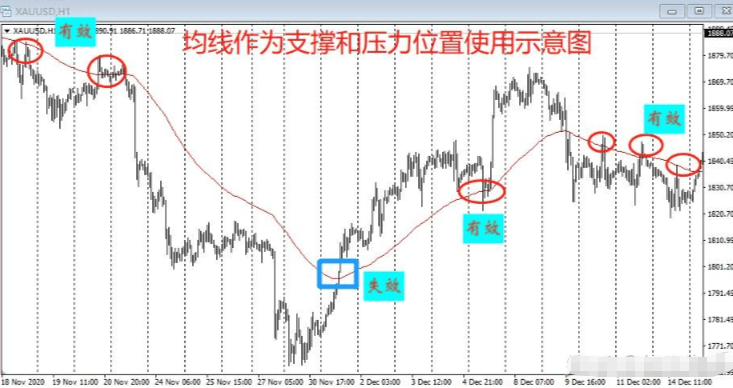
The chart shows the 1-hour candlestick of gold, with the EMA90 acting as a support and resistance position.
Points of Note:
(1) Once a certain moving average parameter is selected as the standard for support and resistance levels, avoid switching frequently.
(2) Moving averages serve as standards for judging support and resistance with a significant advantage: moving averages are automatically generated on the chart, clearly and objectively, without the need for subjective judgment from traders.
(3) Do not use moving averages with too small parameters as support and resistance. Small parameter moving averages are too close to the market, with rapid changes and high trading frequency, which is not conducive to execution. At least use moving averages with parameters above 30.
Method 4: Trend lines and channel lines.
Trend lines and channel lines belong to the same category of trend judgment indicators.
(1) Once the trend line is established, it serves as support or resistance until it is broken in the opposite direction. An upward trend line has a support effect, while a downward trend line has a resistance effect.
(2) The upper and lower channels of channel lines serve as support and resistance, and the market testing them may lead to reversals, which can be used as a basis for opening and adjusting positions.
Look at the illustration:
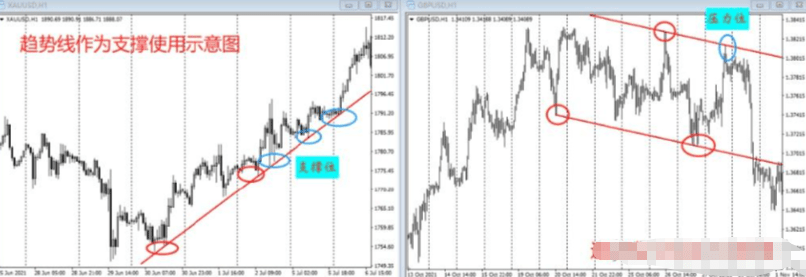
The left side of the chart shows the 1-hour upward trend of gold. After the trend line is formed, the market has tested it multiple times and stabilized upwards.
On the right side of the chart is the GBP/USD 1-hour candlestick chart. In the upper blue circle, the market reverses due to the pressure from the upper limit of the downward channel.
Points of Note:
(1) Drawing trend lines and channel lines on the chart requires some subjective judgment from the trader. In practice, try to draw lines during halts or when not holding positions. After drawing the lines, wait for the market to backtest and try not to make random adjustments.
(2) Draw lines and trade at the current level, do not use different levels for trading.
Method 5: Fibonacci retracement.
The Fibonacci retracement is used for support and resistance in two ways.
(1) Fibonacci retracement lines.
After the market establishes a direction, it usually retraces to support or resistance before continuing to run. The Fibonacci retracement levels of 38.2%, 50%, and 61.8% are the most commonly used retracement positions.
(2) Fibonacci extension lines.
After drawing the Fibonacci retracement lines at the high and low points of a market trend, the Fibonacci indicator will automatically calculate expansions at 1.618 times, 2.618 times, and 4.236 times, with these expansions serving as support and resistance.
Look at the illustration:
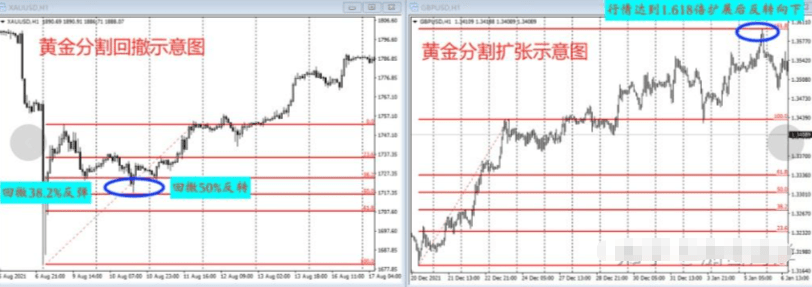
The left side of the chart shows the Fibonacci retracement diagram. After establishing an upward trend, the market first retraces to 38.2%, briefly rebounds, and then retraces again to 50%, forming a reversal candlestick, with the market moving upward.
The right side of the chart shows the Fibonacci extension, where after a bullish trend is established, a brief horizontal consolidation occurs, and the trend continues to rise. When the Fibonacci extension reaches 1.618 times, the market reverses downward.
Points of Note:
(1) Fibonacci extension positions are commonly used as profit-taking targets.
(2) Draw Fibonacci retracement lines starting from the beginning of the market to the end, and draw Fibonacci extension lines from the end back to the beginning.
Method 6: Breakout of Consolidation Patterns and Necklines.
(1) In consolidation patterns, before a breakout occurs, the upper and lower limits of the pattern serve as support and resistance.
(2) After the neckline of the consolidation pattern is broken, the trend may continue, representing a breakout trading opportunity.
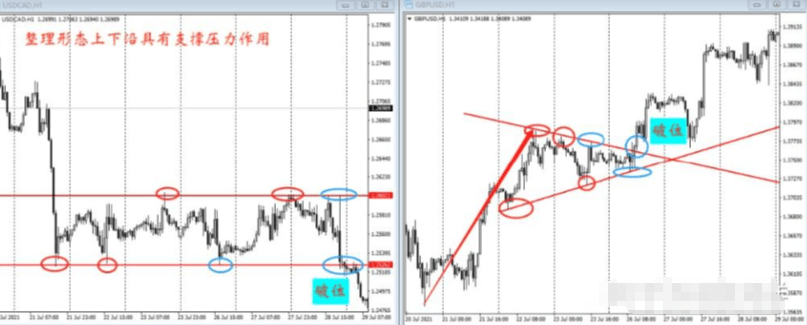
The upper and lower limits of the rectangular consolidation on the left side of the chart formed a reversal trend after the market tested them. The last test below led to a downward break, allowing entry to short, continuing the bearish trend.
The right side of the chart shows a triangular consolidation pattern. The market tests both the downward trend line and the upward trend line of the triangle, forming a reversal trend. Finally, the market breaks upward, allowing entry to go long, continuing the bullish trend.
Points of Note:
(1) If the amplitude of the consolidation pattern is not large, and the profit potential is small, only trend-following trades should be chosen. For example, in the triangular consolidation shown on the right side of the chart, only go long at the lower edge of the consolidation, waiting for the market to break upward.
(2) The longer the consolidation period, the greater the probability of a breakout from the pattern. When trading in the direction of the trend, the position should be increased.
Method 8: The Concept of Support and Resistance Bands.
In practice, the market will form a consolidation and fluctuation near support or resistance levels, and even create false breakouts of support and resistance, leading to many orders being stopped out by false breakouts.
Therefore, understanding support and resistance as a region provides better stability for trading opportunities within that region.
The use of support and resistance bands has two scenarios:
(1) Near support and resistance, select one or two nearby high and low points as a support or resistance zone for trading. Look at the diagram below.
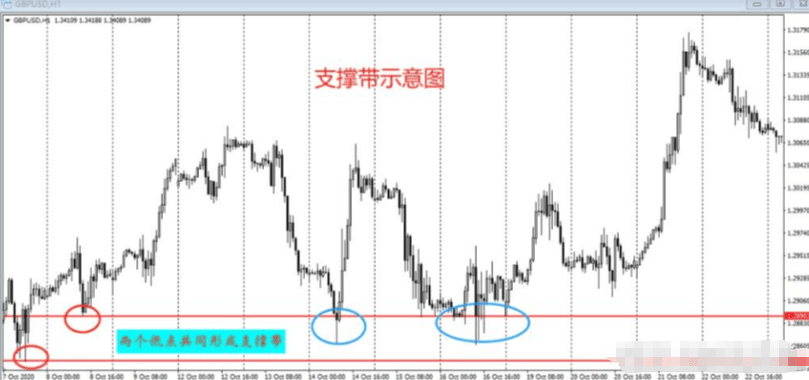
After the market tests the support level downward, select two nearby previous low points to form a support band. Once the market stabilizes within the support band and forms a reversal structure, trading can commence.
(2) Different indicators that judge support and resistance can resonate in price areas that are close to each other, and this area can serve as a support or resistance band for trading. Look at the diagram below.
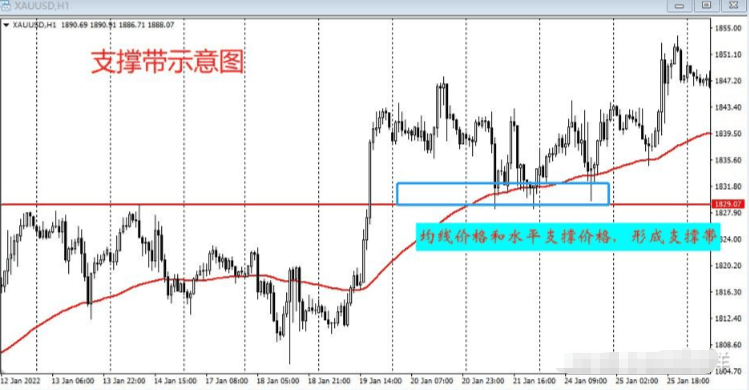
The horizontal support line and moving averages form a support band. When the market stabilizes within the support band and forms a reversal structure, it is time to go long.
Points of Note:
When trading within the support and resistance band areas, it is advisable to combine with entry patterns as it makes setting stop-loss and managing funds easier.
3. Notes on Support and Resistance.
1: Resonance usage.
(1) Different methods for judging support and resistance levels can be used in resonance, such as the resonance between trend lines and moving averages, or between trend lines and horizontal lines, etc.
(2) Support and resistance levels combined with entry patterns or other indicators in resonance. For example, entering when a break structure forms at the support or resistance level, or when support and resistance coincide with MACD, or indicators like RSI that indicate overbought or oversold conditions.
Note: 2-3 indicators in resonance are the most common and effective resonance trading.
2: The effectiveness of support and resistance that has been tested multiple times is the best.
Moreover, once a reverse breakout occurs, the range of movement can be larger.
3: The essence of trading is trial and error; all support and resistance effectiveness is probabilistic.
When using support and resistance levels to form a trading system in practice, strict stop-loss must be enforced, and position management must be done well.
The above is a collection of 7 methods for judging support and resistance levels. Everyone should choose 2-3 to use, and be sure to review and practice before practical application.
I am A-Xin. If you don’t know what to do during a bull market, click on my profile, follow me for free shares on spot trading strategies and contract secrets.


