Entering the cryptocurrency circle from 50,000 to 100,000, then to 302,000, reaching 590,000 in the third year, 3.78 million in August of the fourth year, over 7 million in November, until in the previous years it was easy to withdraw 30 million from the cryptocurrency circle.
Success is by no means accidental. Every successful person has gone through countless trials and has walked step by step to achieve it. It is undeniable that some people are born geniuses, but such individuals are rare, neither you nor I are among them. Most people gradually move towards perfection after experiencing repeated failures. It is precisely these experiences of failure that lead to insights and principles that cannot be grasped through shortcuts.
A common saying is that there are no good opportunities; in fact, opportunities are reserved for the prepared. Only when opportunities arise can one be ready to seize them. Waiting idly is akin to waiting for opportunities to come; when they do appear, one might either miss them or be unable to grasp them.
Why do some traders always manage to be on the right side of the market?
Can they really predict significant price fluctuations before they happen?
Experienced traders often use proven methods to help them understand market operations and make better decisions.
One method is the 'Wyckoff Theory', which this article will elaborate on.
At first glance, Wyckoff's concepts may seem difficult to understand or even somewhat outdated.
But if you know how to properly apply Wyckoff's ideas, it can provide a huge advantage to your trading strategy.
As long as you focus on the following key aspects, you will see the powerful effects of these techniques on trading:
⊚ What is Wyckoff?
⊚ Wyckoff's Three Laws
⊚ The Composite Man Concept in Wyckoff
⊚ Market phases: Absorption, Markup, Distribution, Decline
⊚ The Limitations of Wyckoff in Modern Markets
Now let's explain each point in plain language.
What is the Wyckoff Theory?
The Wyckoff method is a trading strategy founded by Richard D. Wyckoff in the early 20th century.
By observing price changes, trading volume, and overall market trends, this method aims to help traders understand the operation mechanism of the market.
The Wyckoff method is groundbreaking because it provides traders with a clear way to analyze the market, focusing on how supply and demand affect prices.
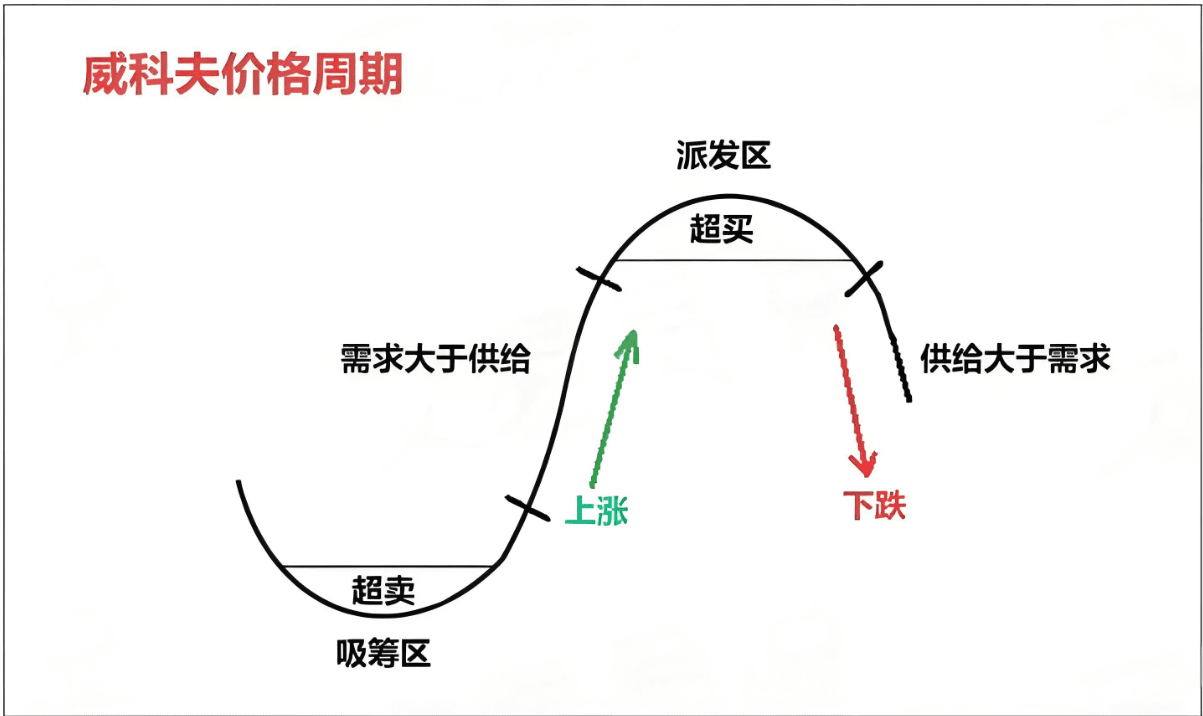
Wyckoff believes that the market moves in predictable cycles, and by studying these cycles, traders can attempt to forecast the next price movement.
The Wyckoff method was originally designed for stock trading, but it can also be applied to forex, futures, and cryptocurrencies.
The core of the Wyckoff method is built on three main concepts:
1. The Law of Supply and Demand: When buying demand exceeds selling, prices rise; when selling demand exceeds buying, prices fall.
2. The Law of Cause and Effect: Large buying or selling (cause) leads to significant price fluctuations (effect).
3. The Law of Effort vs. Result: By comparing the degree of trading activity (effort) with the magnitude of price fluctuations (result), traders can assess the strength of market trends.
Overall, this approach provides you with a way to interpret market signals and helps you make more informed judgments in buying and selling decisions.
The three laws of Wyckoff theory
Wyckoff Law #1: The Law of Supply and Demand
Most importantly, Wyckoff's trading theory is based on the law of supply and demand.
It's very simple, when buying demand exceeds selling (demand exceeds supply), prices rise; when selling demand exceeds buying (supply exceeds demand), prices fall.
This concept stems from basic economics and helps explain why financial market prices fluctuate so dramatically.
But how do traders apply the Wyckoff method in practice?
It's simple, watch the price and trading volume data to see whether supply or demand is dominant!
For example, if prices rise and trading volume is high, this indicates strong demand, and prices may continue to rise.
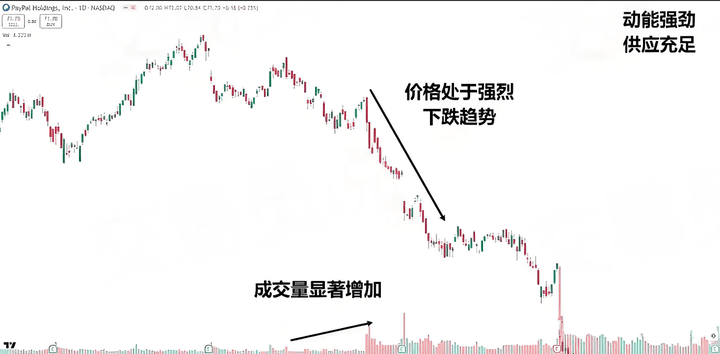
Conversely, if prices fall and trading volume increases, this indicates strong supply, and prices may continue to decline.
Example: PayPal daily chart shows a strong downward trend with increasing trading volume:
This point is especially important in the absorption phase (buying) and the distribution phase (selling)...
In the absorption phase, wise traders buy quietly, gradually increasing demand without excessively pushing up prices.
As the number of available stocks for trading decreases, prices begin to rise, eventually forming an upward trend!
During the distribution phase, these traders begin to sell, increasing supply and leading to price declines.
Understanding this flow of funds can help you determine potential turning points in the market and how to plan your trading strategy.
Next, let’s look at the second law - the Law of Cause and Effect.
Wyckoff Law #2: The Law of Cause and Effect
Another important concept in Wyckoff's trading method is the Law of Cause and Effect.
It points out that every significant price fluctuation has its cause.
In simple terms, the buying or selling volume (cause) that occurs before price changes determines the magnitude of the price change (result).
This rule helps you estimate better how much prices may rise or fall after a period of buying (absorption) or selling (distribution).
For example, in the absorption phase, the 'cause' is that smart traders buy stocks slowly and quietly.
The longer and stronger this buying phase lasts, the greater the price jump ('effect') when the new upward trend begins!
Example: The Law of Cause and Effect
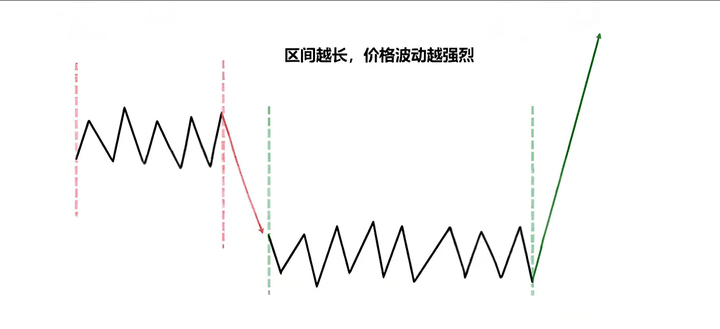
With this in mind, traders can set realistic price targets and maintain more patience, as large price fluctuations often take time to manifest.
Identifying the 'cause' in the market enables traders to prepare for the 'result', thus seizing opportunities for significant price changes.
Wyckoff Law #3: The Law of Effort vs. Result
Another important concept in the Wyckoff method is the Law of Effort vs. Result.
It indicates that the 'effort' in trading (usually measured by trading volume) should match the 'result' (price change).
When effort matches results, this usually indicates a strong trend.
But if the two do not match, it may indicate that the trend is weakening and could even reverse.
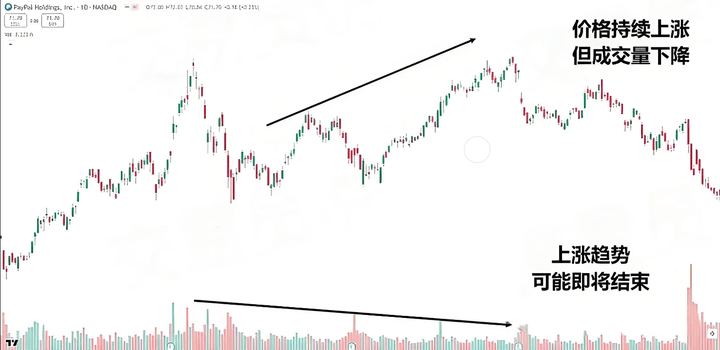
For example, to verify if the upward trend is strong, you need to observe that both price and trading volume are rising.
But if prices continue to rise while trading volume declines... then you may be facing a weakening trend that could soon reverse...
Example: PayPal daily chart shows weakening trend
For a downtrend, if prices fall and trading volume is high, it indicates strong selling pressure, and prices may continue to decline.
However, if prices fall but trading volume decreases, it may indicate that selling pressure is weakening, and a reversal may be imminent.
This fundamental rule helps you discover potential market changes by observing the degree of matching between price and trading volume.
It also serves as an example of how analyzing trading volume can often provide clues about imminent price changes.
Now, you might ask: Who is operating behind these large fluctuations?
Let's see what the Wyckoff theory has to say about this...
The 'Composite Man' in Wyckoff Theory
One of the most interesting parts of the Wyckoff theory is the concept of the 'Composite Man'.
The Wyckoff method envisions the market influenced by a virtual figure known as the 'Composite Man'.
This figure represents the most powerful and influential operators in the market - often referred to as 'smart money' or 'big funds'.
These are typically large institutional investors, hedge funds, and other major market participants with capital and influence.
Wyckoff believes that the Composite Man's goal is to buy a large amount of stocks when prices are low (absorption) and sell these stocks when prices are high (distribution).
But the key is that the Composite Man operates in a way that conceals his true intentions.
During the absorption phase, he quietly buys without excessively pushing up prices.
In the distribution phase, he sells in a rising market, often using news and market sentiment to ensure trades are executed at the best prices...
Composite Man Theory:
For traders using the Wyckoff method, understanding the Composite Man's actions is crucial.
It helps traders identify different phases of the market, such as when big funds are buying stocks (absorption), selling stocks (distribution), and the resulting price increases (markup) or decreases (decline).
Your goal is to align your trades with the actions of the Composite Man:
When the Composite Man buys, you follow and buy...
When the Composite Man sells, you follow and sell...
…This way, you can stand on the right side of the market!
Isn't this an interesting theory?
Now, let's take another look at the market phases of the Wyckoff method...
Analysis of the four phases of Wyckoff Theory
Absorption phase
Absorption phase illustration:
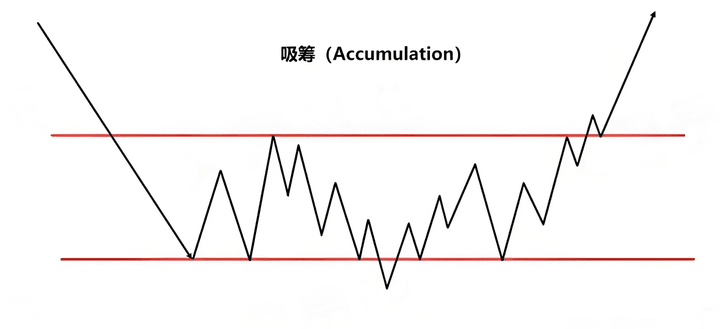
As shown in the image above, the absorption phase is the stage where the market stops declining and begins to stabilize.
After prices experience a period of decline, they will fluctuate laterally within a narrow range.
During this period, the market has no clear direction - prices fluctuate slightly as buyers and sellers are evenly matched.
So, why does this happen?
The emergence of this phase is due to some wealthy and experienced investors (often referred to as 'smart money') starting to buy assets at low prices, believing this is a great opportunity.
They will slowly and cautiously buy to avoid causing a sudden price increase, thus revealing their intent to other investors.
The absorption phase indicates that the downward trend may be nearing its end, and the market may be preparing to rise again.
Once buying pressure is sufficient to exceed selling pressure, prices will start to rise.
Identifying this absorption phase is crucial because it allows you to enter the market before it transitions into the next phase - the markup phase, where prices will begin to rise significantly.
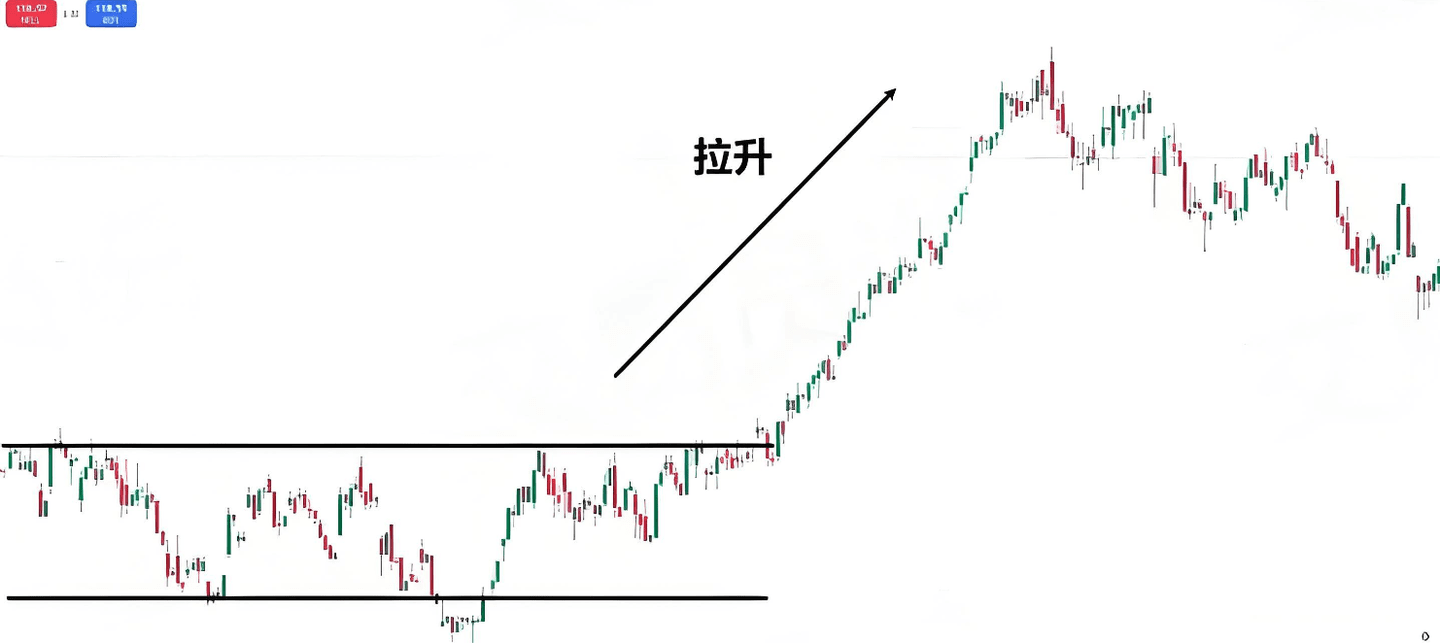
Markup phase
Markup phase illustration:

The markup phase is the period when prices start to rise steadily, breaking the consolidation pattern during the absorption phase.
The market enters an uptrend, forming higher highs and higher lows.
For traders who buy during the absorption phase, this is often the most profitable period.
The emergence of the markup phase is because large funds ('smart money') have bought most of the available stocks, reducing supply in the market.
As more investors notice the upward momentum, they also begin to follow and buy, further driving up prices.
Positive news or strong economic data often boost this phase, attracting more buyers into the market.
The markup phase indicates that the market is in a strong upward trend, usually accompanied by increasing demand and enhanced investor confidence.
At this point, more people, including ordinary retail traders, begin to follow the trend.
Can you see the importance of buying during the absorption phase?
If you miss it, you may only enter the market during the markup phase, and by then, prices may already be high.
So, when should you sell?
It’s time to enter the next phase - the distribution phase...
Distribution phase
Distribution phase illustration:
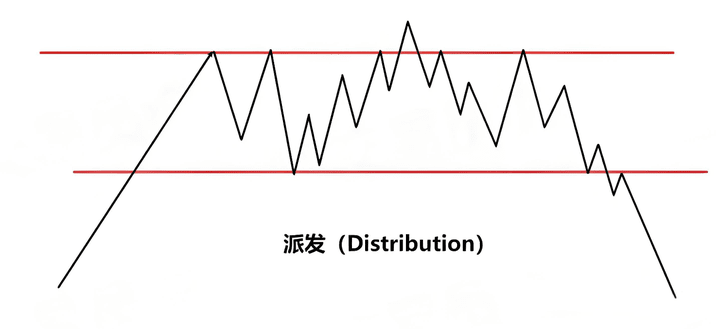
The distribution phase is when the market's upward trend begins to lose momentum, and prices enter a sideways consolidation phase again.
Unlike the absorption phase, which occurs after a downtrend, the distribution phase occurs after a significant uptrend.
During this period, prices fluctuate within a range, and strong upward momentum begins to weaken.
Why does this happen?
In the distribution phase, 'smart money' that had previously bought during the absorption phase begins to sell their positions to lock in profits.
They will offload their positions to a broader market, usually selling to retail investors who entered late due to the previous uptrend.
The distribution phase indicates that the upward trend is weakening, and the market may be about to reverse.
As selling pressure increases, the market struggles to continue rising, setting the stage for the next phase - the declining phase.
Declining phase
Declining phase illustration:
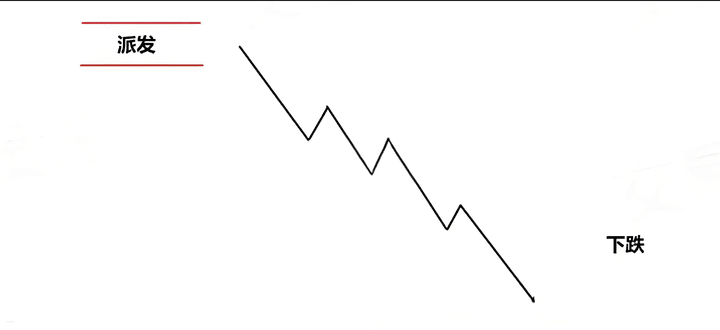
The declining phase is the period when prices start to drop continuously, marking the beginning of a new downward trend.
The market shows lower highs and lower lows as selling pressure exceeds buying interest.
This phase can sometimes trigger panic selling, causing prices to drop faster.
The emergence of the declining phase is due to the market realizing that the previous uptrend has ended.
Those who bought in the late rising phase begin to sell to stop losses or protect profits.
As prices continue to decline, more investors engage in panic selling, further driving prices down.
This declining phase indicates that the market is in a bear market, with a clear downward trend.
Investors who fail to detect the market's turn during the distribution phase may suffer significant losses, while those who sell early avoid most of the downside risk.
Thus, understanding Wyckoff's market phases can help you determine your position in the market cycle.
This is a valuable tool for assessing potential market trends and making more informed trading decisions.
Wyckoff Theory: Real trading examples
Before explaining the markup and declining phases, let's first look at some stock examples to understand how the absorption and distribution phases are reflected.
At the same time, it is important to remember that the illustrations of absorption and distribution phases are subjective.
It requires practice and experience to identify in real-time, so if you don't master it perfectly at the beginning, don't be too hard on yourself.
That said, let’s look at the differences in price movements in key areas on the chart...
XOM 4-hour chart - Absorption phase:
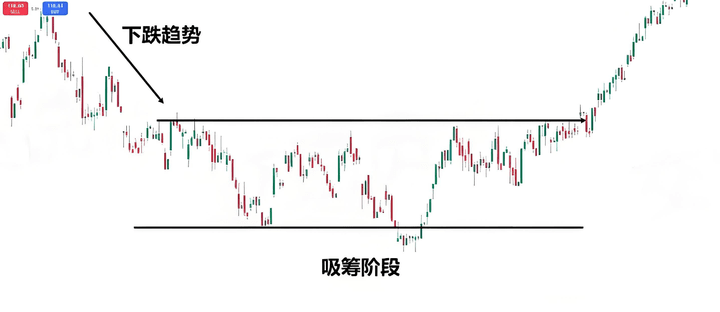
Can you see that the price was originally in a stable downtrend, continuously making lower lows and lower highs?
But then, the price movement changed.
Prices do not continue to maintain the original pattern but start forming equal highs and lows after making lower lows, suggesting that market behavior may be changing.
As prices continue to fluctuate, it experiences a spring - prices briefly drop below the range low but then quickly rebound to the range high.
This rapid rebound indicates that buyers are starting to intervene, which may suggest that the market is preparing for the markup phase...
XOM 4-hour chart - Absorption breakout:
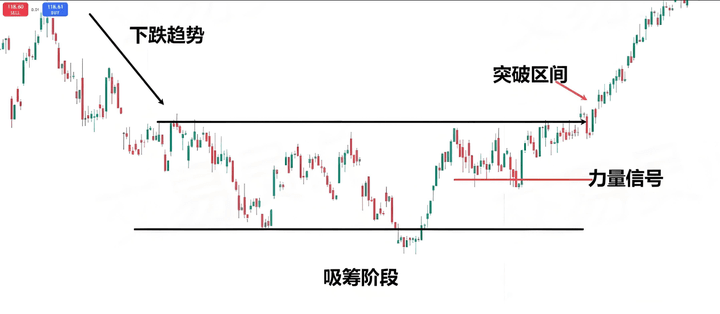
At this stage, prices maintain near the range high and form new minor support levels, also known as power signals...
XOM 4-hour chart - Markup phase:
Subsequently, the price eventually breaks through the upper limit of the range, marking the beginning of the markup phase.
Did you understand?
Next, let's look at an example of the distribution phase...
PayPal daily chart - Markup phase:
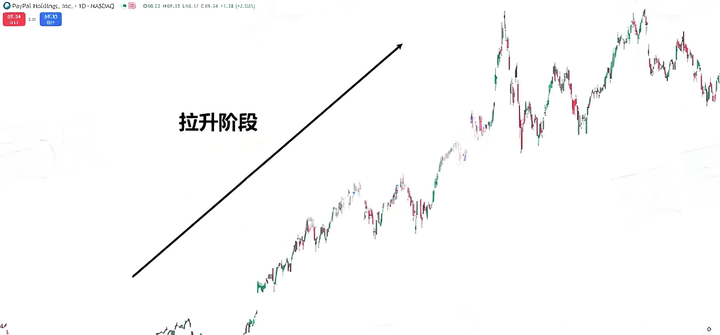
As you saw in the PayPal daily chart, the price was initially in a stable uptrend, constantly making higher highs and higher lows...
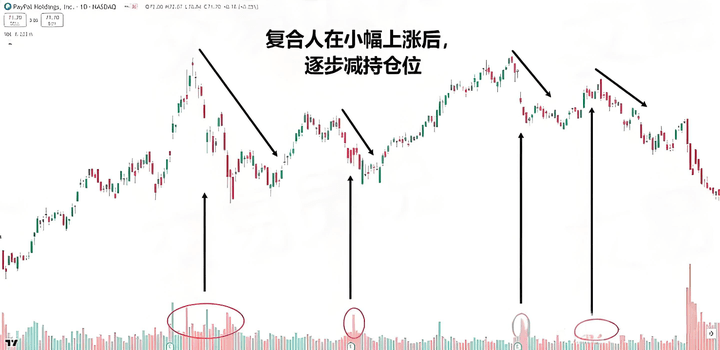
PayPal daily chart - Distribution phase:
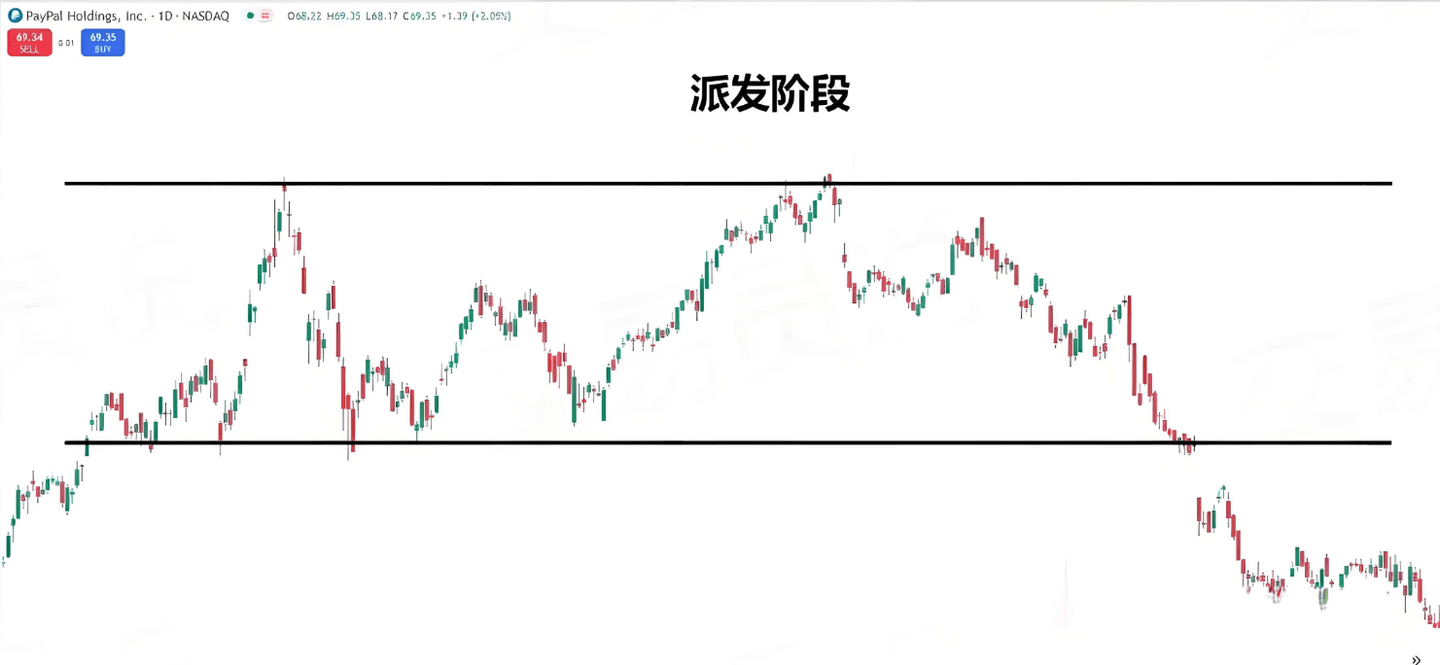
However, in the high point area of this trend, prices began to fluctuate within a range, repeatedly attempting to break through previous highs but failing.
This is the first signal that a market reversal may occur.
When prices break below the range low and fail to hold it as support, it clearly indicates that this is the distribution phase of the market cycle.
Next, let's see what happens next...
PayPal daily chart - Declining phase:
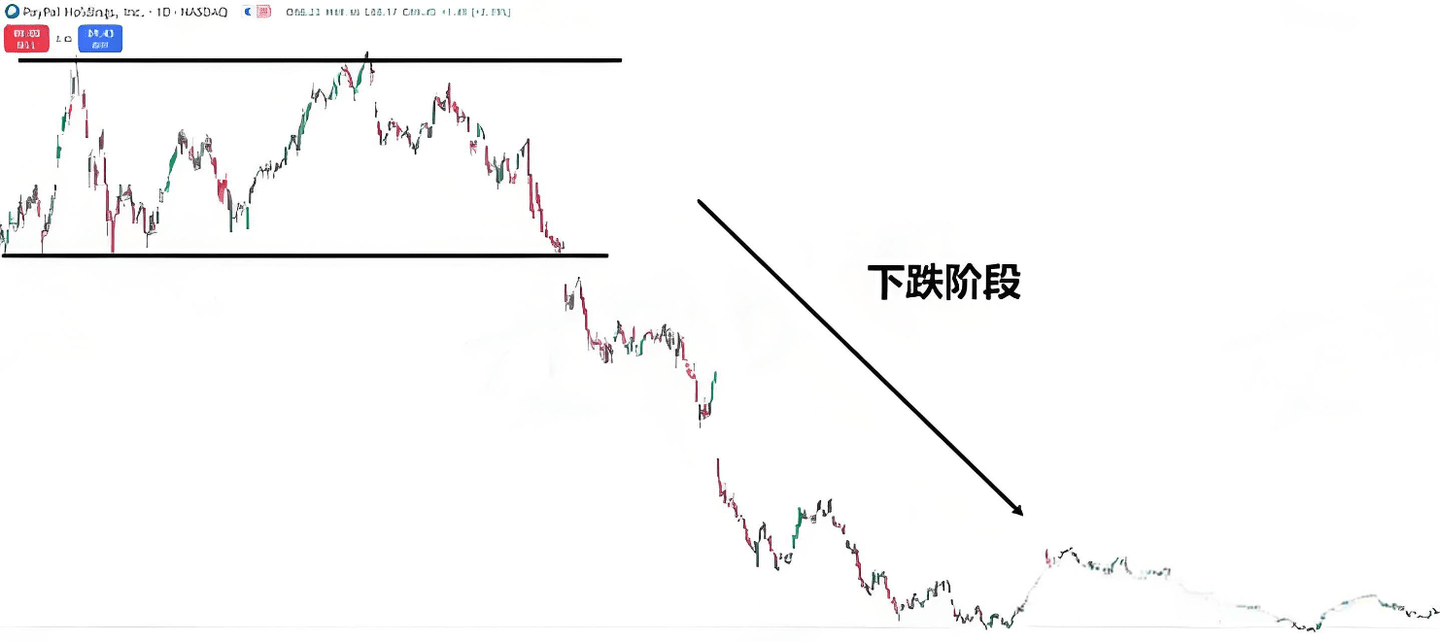
You can see that during the declining phase, prices continue to trend downward.
Thus, it is very important to pay attention to whether the market is struggling.
The equal highs formed in the distribution phase and the equal lows formed in the absorption phase can hint at the upcoming market movements!
Carefully tracking the price movements in these phases can provide clues for future trends.
Of course, this is not always obvious, as the shapes and sizes of market phases can vary...
However, by asking yourself, 'What stage am I in the market right now?' you can determine if you're buying at the right price.
For example, if you notice that prices are in the markup phase but start to fluctuate within a range...
Does this mean the market may enter a distribution range? Could the upward trend be nearing its end?
Finally, let me share a set of iron rules for the cryptocurrency world: Understand explosive growth!
Rule One: Preserve your capital to survive in the market long-term. Capital is the lifeline and must be firmly protected! Many people ignore risks in pursuit of high returns, resulting in heavy losses.
Rule Two: As long as you are not greedy, making a profit is actually very simple. Maintain a stable mindset, earning a little is easier to accumulate wealth.
Rule Three: Concentrated investment, don’t go all in, follow the trend. Avoid blind diversification, do not invest all your capital, and adjust your strategy according to market trends.
Rule Four: Avoid heavy positions, do not stubbornly hold on, trade less. Control your position, do not hold onto losses stubbornly, moderate trading is sufficient.
Rule Five: Enter calmly, exit decisively, and enforce stop-loss firmly. Do not rush to buy, sell decisively when the time comes, and strictly follow the stop-loss line set.
Rule Six: Market profits are limitless, but losses can be bottomless. Don't be greedy for money that cannot be earned, but losses can deplete everything.
Rule Seven: Once a stop-loss is triggered, exit immediately. A stop-loss is a protection for your account and should not be hesitated.
Rule Eight: Long-term and short-term, securing profits is the safest strategy. Whether trading long or short, the ultimate goal is to ensure profits.
Rule Nine: The unchanging truth of the market is that extremes lead to reversals. Regardless of rises or falls, there is a limit that must reverse.
Rule Ten: Don't trade when there are no opportunities; missing out is not terrifying. Don't force yourself to seize every opportunity; capturing a portion is enough.
Rule Eleven: Waiting for the right opportunity is more important than blind trading. Do not rush to seek trading opportunities; patience is more advantageous.
Rule Twelve: After achieving your goals, stop trading, conserve energy, do not be greedy, exit timely after completing daily goals, and retain energy for the next trade.
Rule Thirteen: Stop-loss is set by yourself, while profits come from the market's grace. A stop-loss is the investor's responsibility, while profits are the market's return.
Rule Fourteen: Wealth comes from waiting, not from frequent trading. The best investments are often gained through patient waiting rather than constant trading.
Rule Fifteen: When mindset is fragile, it is most important to strictly follow the strategy. Desires can easily get out of control in trading; only by strictly executing strategies can one achieve unity of knowledge and action. These rules may seem simple, but they are not easy to execute. Only those who can truly do so can become the ultimate winners!
The above '15 Iron Rules of Trading Cryptocurrency' are the essence of my trading experiences gained through years of real money. I sincerely hope they are useful, and after reading them, you can integrate them into your operations for better results, aiding you in the cryptocurrency world and avoiding years of detours.
These are some of my views and insights, if you find them helpful, feel free to like and save. I am Yan An, someone who has experienced three rounds of bull and bear markets, skilled in logical coin selection and technical timing, trading only within my cognitive range, and each direction has been validated by the market!
Even the most diligent fisherman wouldn't go out to sea to fish during a stormy season, but rather would guard their boat carefully, knowing that the season will pass and sunny days will return! Follow Yan An for guidance, both in fishing and in trading. The doors of the cryptocurrency world are always open; go with the flow to lead a successful life, and keep this in mind!
