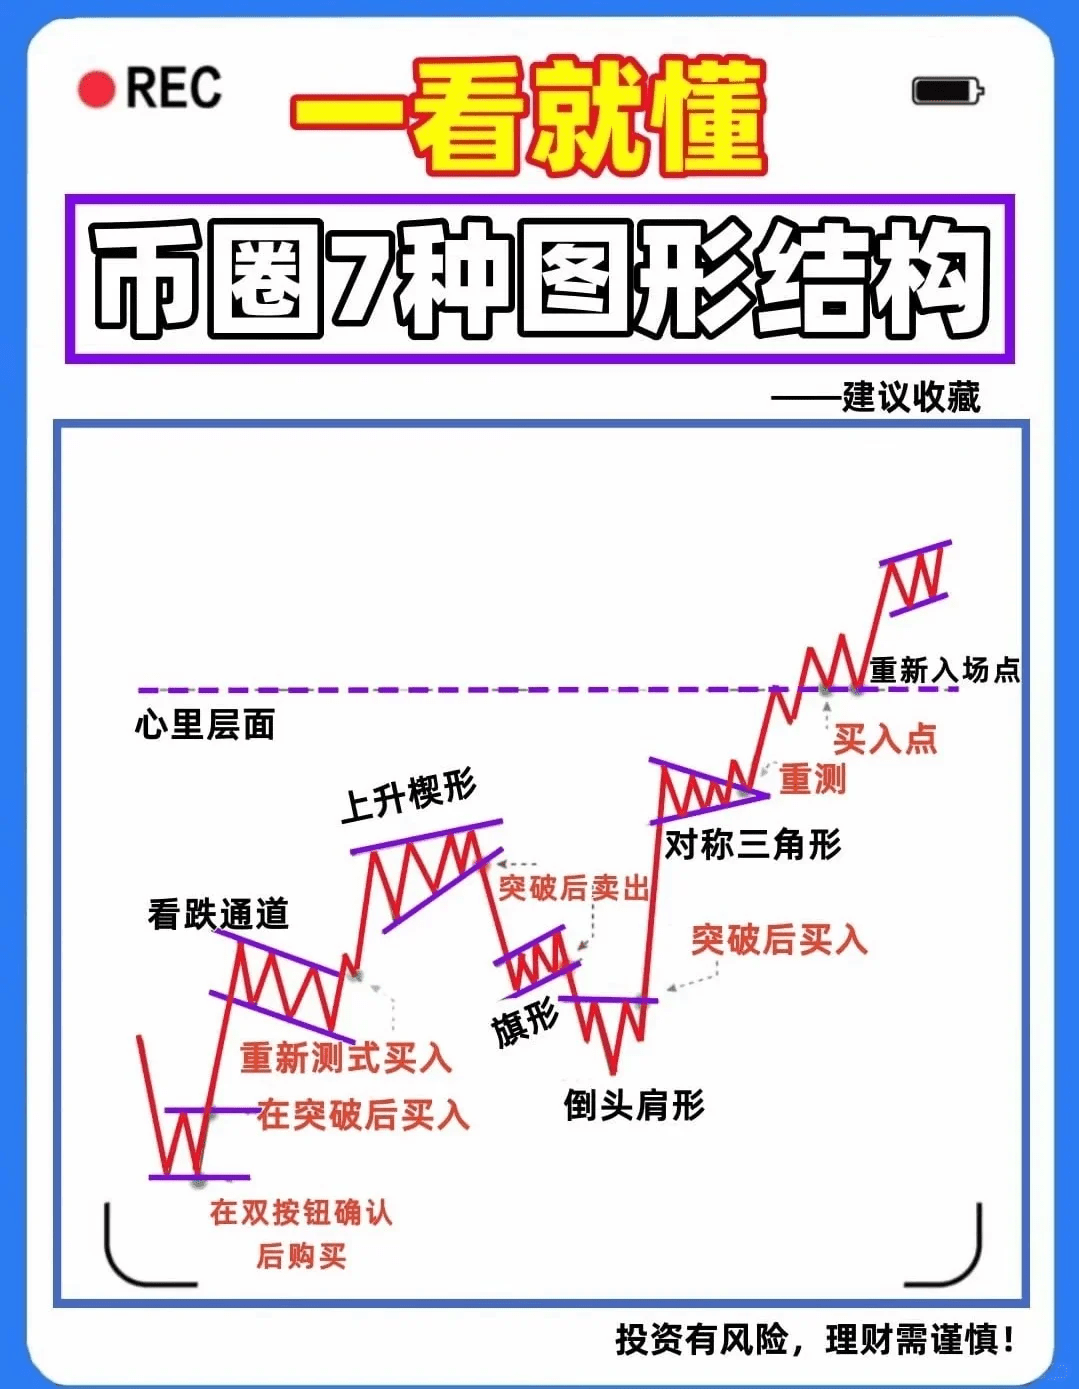
I have reviewed this chart dozens of times, today I will break down 7 classic patterns for everyone, I have summarized each one:
Scene occurrence, how to catch buying points, how to allocate positions, etc.
① Bearish channel: Low position reversal signal
🔹 Commonly seen after a sharp market drop, prices oscillate downwards at the bottom
🔹 Buy point: Breakthrough upper track or double bottom confirmation
🔹 Position: Initial breakthrough at 30%, confirm with a pullback then add another 30%
Beginners often miss this wave! In fact, the real launch often occurs during the breakthrough at that time
② Ascending wedge: High position baiting trap
🔹 It seems to be rising, but its strength is getting weaker
🔹 Selling point: Take profit immediately when breaking the lower bound or go short
🔹 Position: Start with a 20% short position, confirm and add more
Many people are going bankrupt here! It seems like a slow bull market, but in fact, large funds are unloading!
③ Spiral: Suppressed energy before market explosion
🔹 Trading volume shrinks, K-line contracts like a spring
🔹 Strategy: Breakthrough on one side, trade on that side, follow with a small position
🔹 Position: 20% trial order, confirm and then add 30%
Don't bet on the direction, patiently wait for the explosion!
④ Inverted head and shoulders: Major bottom reversal
🔹 The shape looks like a 'W', which is a strong reversal signal
🔹 Buying point: After breaking the neckline, it's a chance to enter before a strong surge
🔹 Position: Buy 30% on breakthrough, add 30% on pullback, increase 20% again when volume rises
This structure often doubles after it appears!
⑤ Symmetrical triangle: Direction selection in fluctuation
🔹 Trend consolidation stage, direction is ambiguous
🔹 Buying point: Break through the upper edge of the triangle, follow the main force to enter
🔹 Position: 30% trial order, confirm on pullback then add 30%
Beware of false breakthroughs, do not enter without volume!
⑥ Psychological pullback: Gold entry point
🔹 After a breakthrough, prices often retrace to previous highs or key support
🔹 Buying point: If it doesn't break on pullback, the moment the K-line stabilizes
🔹 Position: Heavy position opportunity, directly enter with 40%!
Such opportunities are very rare, but once they appear, they are 'low risk + high return'
⑦ Platform fluctuation ➜ Main upward wave is ready to take off
🔹 High-level consolidation looks like a W shape, the main force is cleaning up floating capital
🔹 Buying point: Break through the upper edge of the platform again
🔹 Position: 30% trial order, strongly increase to full position
Many people think it is sideways, but in fact, it is the prelude to a big market!
Recommendation summary:
“The shape does not predict the future, but discovers what the main force is doing”
✅ Do not be aggressive when entering, follow with divided positions
✅ Set a stop loss when exiting, do not get attached
✅ Combine K-line patterns and trading volume for more stability
✅ Every structure is worth looking at multiple times!#比特币 #区块链 #币圈 $BTC $ETH