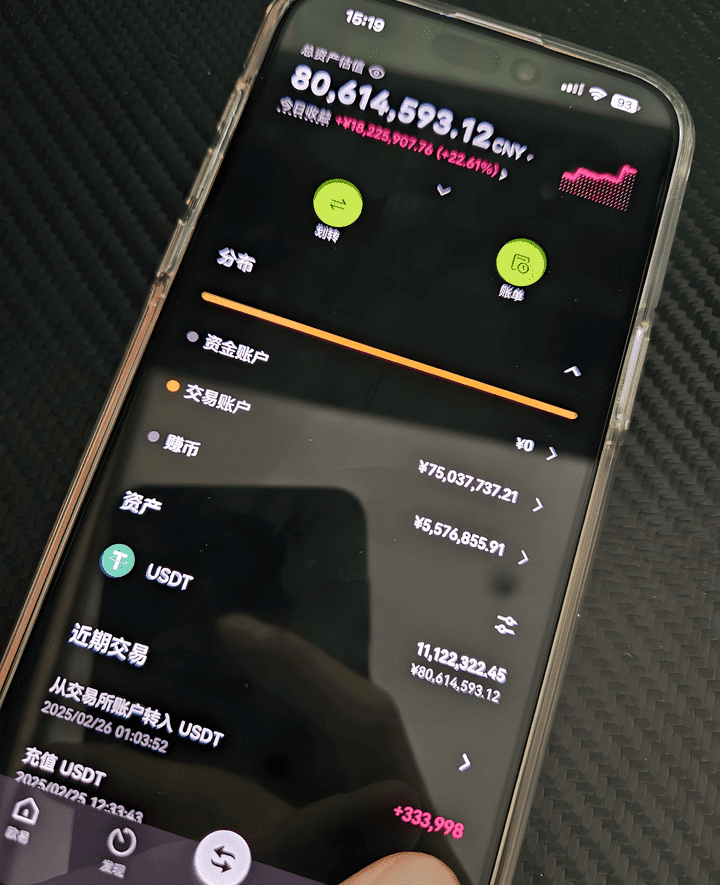
When I first entered the cryptocurrency market 14 years ago, I was just a fresh graduate with 200,000 yuan of startup capital from my parents. Now, after 8 years of struggles in this field, having experienced three bankruptcies, at one point losing so much I couldn't even pay rent, I also turned 500,000 yuan into 80 million during the bull market in 2021 through precise layout.
Trading cryptocurrencies is a simple matter, don't complicate it!
In the world of financial speculation, losses are like an invisible ghost, shadowing every trader. Regarding the two outcomes of trading—profit and loss—making a profit always brings joy, but how to properly deal with losses often determines whether a trader ends up making money or losing money.
A common phenomenon is that when traders experience paper losses, many choose to hold on without stopping losses. In certain trades, this may not be wrong, as many times one can recover from losses or even turn them into profits. However, looking at the overall trading results over a certain time period, this is indeed the main reason for ordinary traders' capital losses.
Overestimating human nature is the root cause of losses in trading. The financial speculation market easily creates an illusion of overestimating one's ability to control emotions and execution. A simple example is: how many people can consistently drive at 100 mph on an empty highway? Most people tend to accelerate unconsciously, often speeding up without realizing it because they feel they are going slower. This is a form of self-affirmation illusion.
Paper losses can exert invisible pressure on traders. The choice not to stop losses stems from the psychological difficulty of accepting actual losses, as there is still room for recovery from paper losses. Once a stop loss is triggered, it results in actual losses with no chance for recovery. However, as losses increase and pressure mounts, traders often become even more irrational.
In fact, the long-short game in trading is a process of psychological competition. From the perspective of an economically rational person, no one would lose money in trading, but losses always occur because pressure causes traders to become irrational. The simplest truth is that the probability of making mistakes increases because they often happen unconsciously. This is human nature.
For trading, whether you pursue win rates or probabilities, you should understand one thing: human nature is the key to trading. When facing repeated wins and losses, that fluctuating mindset of wanting to win and fearing to lose is what every trader needs to constantly reflect on. To learn trading, first learn how to be a person; the deeper life principles are not about life itself, but overcoming the negative factors in human nature is a prerequisite for good trading.
What I want to share today is: 'The essence of trading is to go with the big and against the small.'
I hope you engrave this sentence in your mind.
1. What is a complex correction?
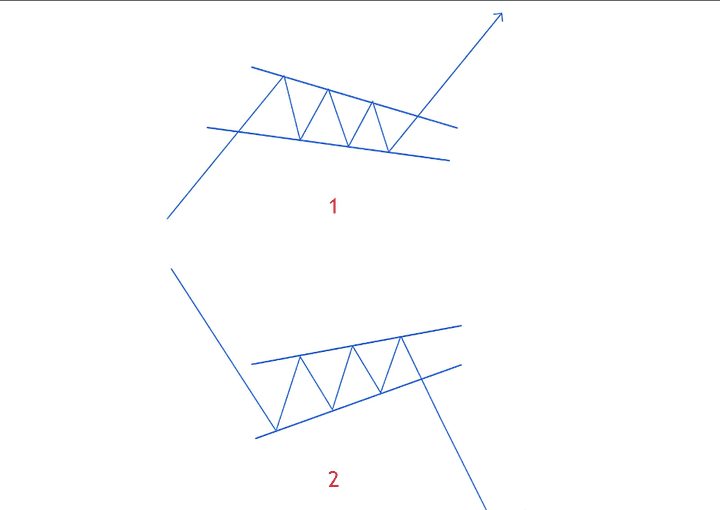
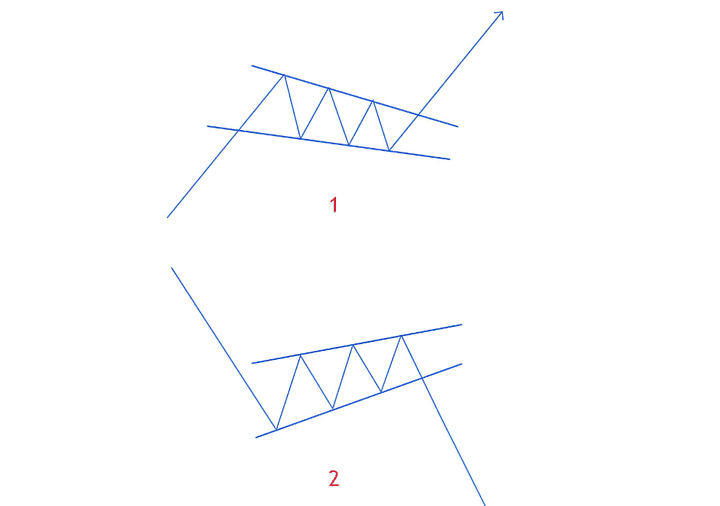
What is a complex correction? In simple terms, as long as a correction shows a certain pattern, we uniformly refer to this correction as a complex correction. For example, we look at the chart below, where a descending wedge appears during an uptrend (as shown in Figure 1). We call this lump a complex correction of this uptrend. It doesn't matter if you don't know what a wedge is; we will discuss it later. Now, looking at the second case, an ascending flag appears during a downtrend, and we say this ascending flag represents a complex correction of this downtrend (as shown in Figure 2).
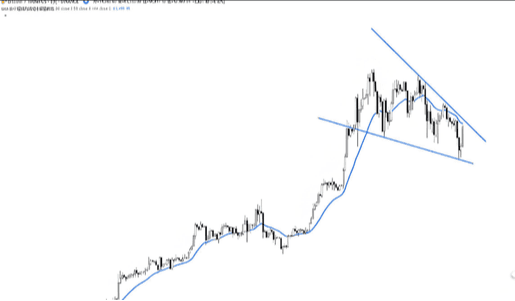
(Figure 1: Descending wedge)
(Figure 2: Ascending flag)
Now please take another look at this chart. Can I consider this lump as a complex correction? Can or cannot? Please answer me: 3, 2, 1 (as shown in Figure 3). The answer is, of course, because it forms a rectangle during the downward process. At this point, you might say, 'Hey, coach, how can this ugly lump be called a rectangle?' That's fine; we can say that this entire irregular shape represents a complex correction of this downward movement. This is what we often refer to in our system classes as 'vaguely correct,' so you see, learning technical analysis is not that difficult.
In summary, any movement that emerges from a pattern, any movement that forms a certain pattern—even if that pattern is something you don't understand or is irregular—we can refer to it as a complex correction of the most recent left-side trend. Of course, we have discussed the more common patterns in our live classes, such as wedges, rectangles, flags, and triangles, etc. Due to time constraints, we will detail wedges next; we will discuss rectangles, flags, and triangles later when we have time.
(Figure 3: Ugly irregular shape)
2. How to buy during a complex correction?
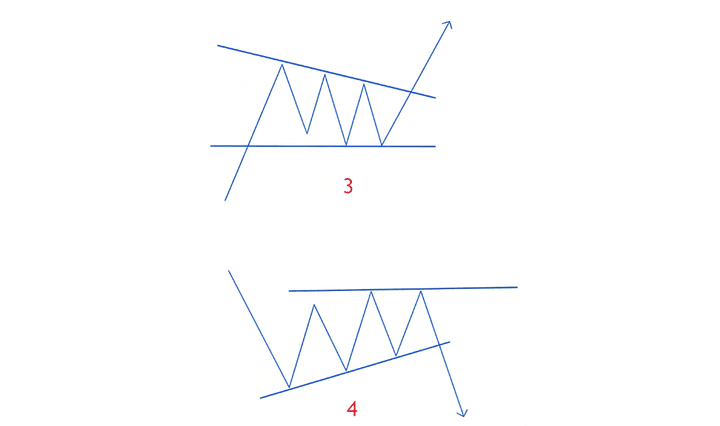
Since we are discussing wedges, let's first understand what a wedge is. Please note that this character is pronounced 'xie' and not 'qi'. So what is a wedge? We actually learned it in our middle school physics class. (As shown in Figure 4) It has convergence and symmetry. After understanding what a wedge is, let's look at these six common types of wedges in the market. (As shown in Figure 5).
(Figure 4)
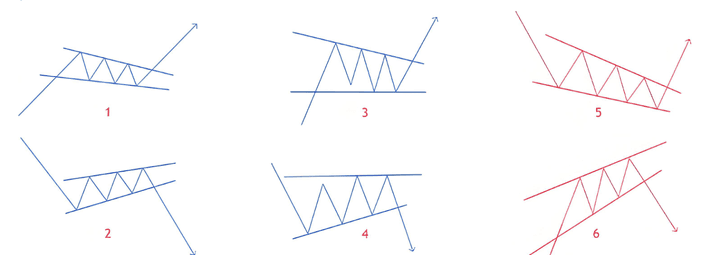
(Figure 5)
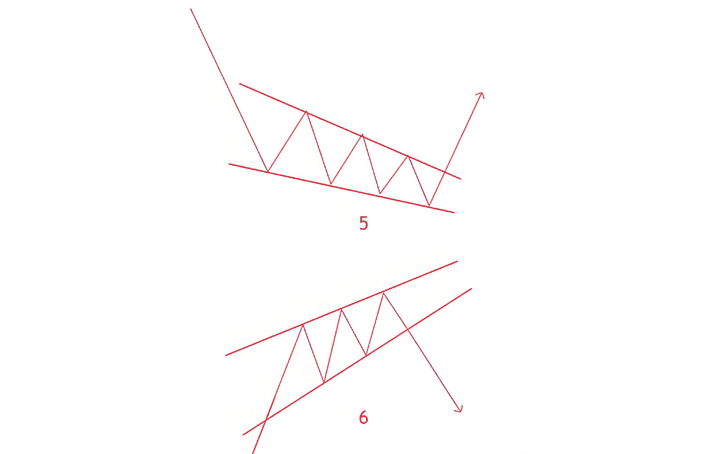
Let's first discuss the first and second types (as shown in Figure 6). Looking at the first example, a descending wedge appears during an uptrend, so we follow this uptrend to trade the reversal of this descending wedge.
So how do we reverse a descending wedge? Essentially, we need to see if this wedge has completed its movement, or in other words, if it has reached the end.
How can we judge whether it is completed or at the end? Our method is to count the push strength of this wedge to determine if divergence has occurred.
For example, taking the first illustrative diagram as an example, this is the first push, second push, third push. In the process of counting pushes, we can clearly see that although each push creates lower highs and lower lows, the distance of each push is getting shorter. At this point, we can say that this wedge shows divergence. As long as these conditions are met, it is likely a sign of weakening momentum, so we can say that this wedge has reached the end. If your style leans towards left-side trading, as soon as you see high 1, you can enter the market to go long, with T1 take profit set at the starting point of the wedge and T2 take profit at an equal distance from the left trend.
(Figure 6)
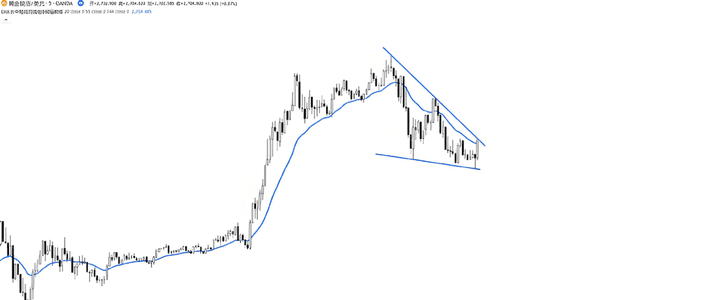
For better understanding, let's now open the market to look at a case. (As shown in Figure 7) This is the daily chart of candied oranges, where a descending wedge appears during a clear uptrend. At this point, we will count the push strength of this descending wedge: one push, two pushes, three pushes. Does this descending wedge show divergence? Is one push weaker than another? The answer is of course it does, as high 1 appears here, which is a bullish engulfing formed by three candlesticks. So we directly enter the market to go long. Set T1 take profit at the starting point of the descending wedge, and T2 take profit at an equal distance from the left trend. However, we often say in live classes that when the water is full, it overflows, and when the moon is full, it wanes. So we will place our take profit around this position, and the subsequent market indeed smoothly hit our take profit point. This is the first common reversal of a descending wedge.
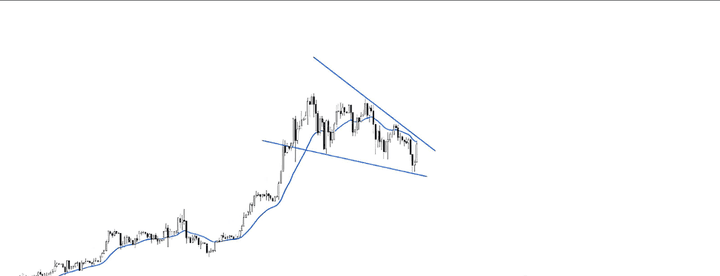
(Figure 7)
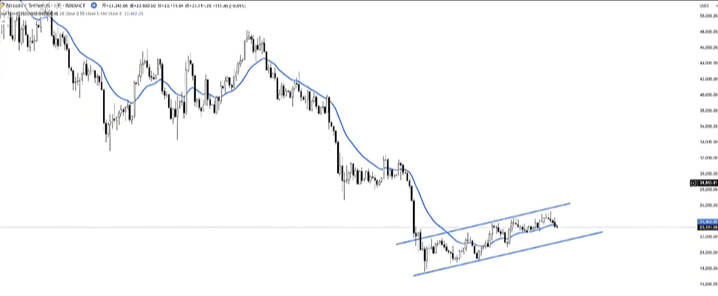
During the downward process, is there the same logic when encountering an ascending wedge? Let's look at the second illustrative diagram. During a downtrend, an ascending wedge appears, and we trade the reversal of this ascending wedge following the downtrend. It's just that we will switch from going long to going short; we won't expand on that here. These are the two most common types of wedges. (As shown in Figure 8)
(Figure 8)
Next, let's take a look at a relatively special wedge. Let's first look at the third illustrative diagram. (As shown in Figure 9)
(Figure 9)
A descending wedge appears during an uptrend, but the last push of this descending wedge does not create a lower low but forms an SB structure with the second push.
Similarly, let's look at a case on the chart (as shown in Figure 10). This is the 5-minute chart of gold spot prices, where a descending wedge appears during a clear uptrend. One push, two pushes, three pushes, the same three pushes show divergence, and the last push does not create a lower low but forms an SB structure with the second push. At this point, we first find high 1, which is the bullish engulfing formed by these two candlesticks, and then find high 2, which is this candlestick. Now can we directly enter the market to go long?
Never forget what we just talked about: when the water is full, it overflows, and when the moon is full, it wanes. Place the T1 take profit slightly below the starting point of the descending wedge, and the subsequent market indeed smoothly reached our take profit point. This is a relatively special reversal of a descending wedge.
(Figure 10)
When encountering an ascending wedge during a downward process, the same logic applies. It's just that the long position is switched to a short position, and we won't expand on that here. This is a relatively special wedge.
To summarize the four types of wedges we discussed above, they share a common characteristic: they all need to follow the larger trend on the left and go against the smaller trend of the wedge. Go with the big, against the small. Therefore, it is best to count pushes during corrections, not in the main trend. I hope you cultivate this habit and never make the following mistakes. (Figure 11)
(Figure 11)
So why shouldn't we count pushes in the main trend, meaning we shouldn't look for ascending wedges in an uptrend or descending wedges in a downtrend? There are mainly two reasons:
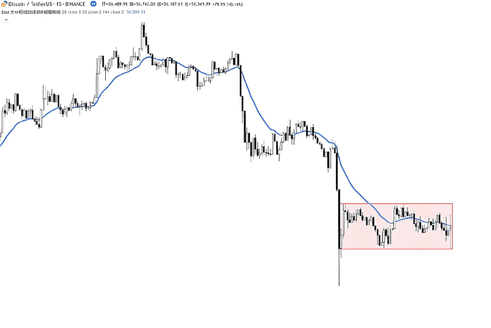
The first reason is that if you count pushes in a main trend, you may count more than three pushes. If a certain market moves in a channel trend, there could even be 4 pushes, 10 pushes, or 100 pushes (as shown in Figure 12). However, the purpose of counting pushes is not merely to count, but to see if the entire wedge shows divergence. This is the first reason.
The second reason, which is also the most important reason: if you count pushes in a main trend, you will inevitably be tempted to reverse that main trend. We have emphasized many times: do not go against the trend, do not go against the trend, do not go against the trend. Therefore, do not count pushes in the main trend; do not count pushes in the main trend; do not count pushes in the main trend. This is extremely important.
The essence of trading is to go with the big and against the small; I hope you engrave this sentence in your mind.
(Figure 12)
To summarize, this is how I buy into a complex correction.
Step 1: Identify the pattern. We have discussed many types of patterns, such as flags, wedges, triangles, rectangles, etc. Today, we will only use wedges as an example. Find a descending wedge during an uptrend, or an ascending wedge during a downtrend.
Step 2: Count the pushes, using the push counting method to see if this wedge has completed its movement and whether there has been divergence.
Step 3: Find entry signals, which means entering at high 1 or in the SB structure.
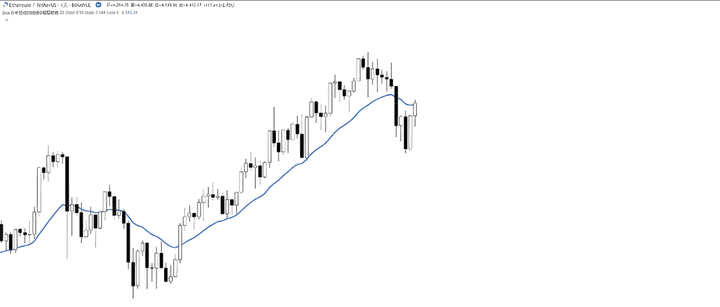
If you are also into technicals, take a look at the following chart:

Lastly, these few iron rules, everyone must comprehend!
1. When the rise is rapid but the fall is slow, the big players may be quietly accumulating. When a cryptocurrency shows a rapid upward trend, but during pullbacks it falls very slowly, this situation must be highly vigilant. It is very likely that big players are quietly stocking up, collecting large amounts of chips to strategically prepare for a strong upward surge. The internal logic is that big players attract market attention through rapid rises, causing retail investors to follow in, while the subsequent slow decline gradually absorbs the chips sold by retail investors at low positions, achieving their control goals and accumulating energy for the next significant rise. #Bitcoin ancient whales continue to clear out.
2. When the drop is sharp but the rise is slow, be wary of early selling from big players. Conversely, if the price drops sharply without warning and then recovers slowly, like a snail's pace, it is highly likely that the big players are methodically selling off their holdings. They sell a large amount of chips at high positions, causing the price to fall sharply, and the subsequent slow recovery is just to confuse retail investors, making them mistakenly believe it is a good opportunity to buy the dip. At this time, the overall market trend may have quietly turned downward, and investors must respond cautiously and not be blindly optimistic.
3. When there is excessive volume at the top, there is still room for action; when there is little volume, run away without hesitation. When the price rises to historical highs, if the trading volume remains high and very active, it indicates that the bullish force in the market is still strong and there is potential for further price increases. High volume means many investors are actively participating in trading, and the market remains heated with continuous capital inflow pushing prices up. However, if the trading volume significantly shrinks in the top area and becomes extremely sparse, this is undoubtedly a dangerous signal, suggesting that the momentum pushing prices up is insufficient, and future increases lack strength. Investors should decisively exit and promptly avoid potential significant decline risks.
4. When a large volume is initially released at the bottom, it's best to observe and not rush in. When the price drops to its lowest point and the trading volume suddenly increases sharply, do not act impulsively and buy immediately. This is likely just a brief technical rebound within a downward trend, not a real bottom reversal signal. In this case, the market often needs more time to further solidify the bottom and confirm the reversal trend. Investors should remain calm, patiently observe, and wait for the situation to become clearer.
5. When there is sustained volume at the bottom, it's the right time to enter. If the price is at a relatively low position and the trading volume can consistently maintain a high level and shows a trend of stable increase, it indicates that funds are continuously flowing into the market, and the bullish forces are gradually accumulating and gaining an advantage. At this time, investors can closely monitor market dynamics, combine with other technical indicators and fundamental analysis, and decisively buy at the right time to ride the wave of price increase and gain investment returns.
Finally, remember:
The cryptocurrency market is a marathon; stability far outweighs quick wins. Gains made by luck will eventually be lost due to lack of skill. Only by integrating position management into instinct can one survive in a brutal market.
Remember: As long as you are alive, you have the right to wait for the next opportunity.
No matter how diligent a fisherman is, he won't go out to sea during a storm, but will carefully protect his fishing boat. This season will pass, and sunny days will come! Follow Lao Chen, and I'll teach you to fish and how to fish. The cryptocurrency world is always open; by going with the trend, you can have a life that flows with the trend. Keep it collected, and remember it well!
$ETH $BTC #国王杯
