Possible 20% Correction Scenario on BTC
On 07/23, Bitcoin (BTC) lost support at $118,000, triggering a deeper correction scenario, projecting a drop of up to 11%, with a direct target around $104,000, an area with strong liquidity accumulation. $BTC $SUI
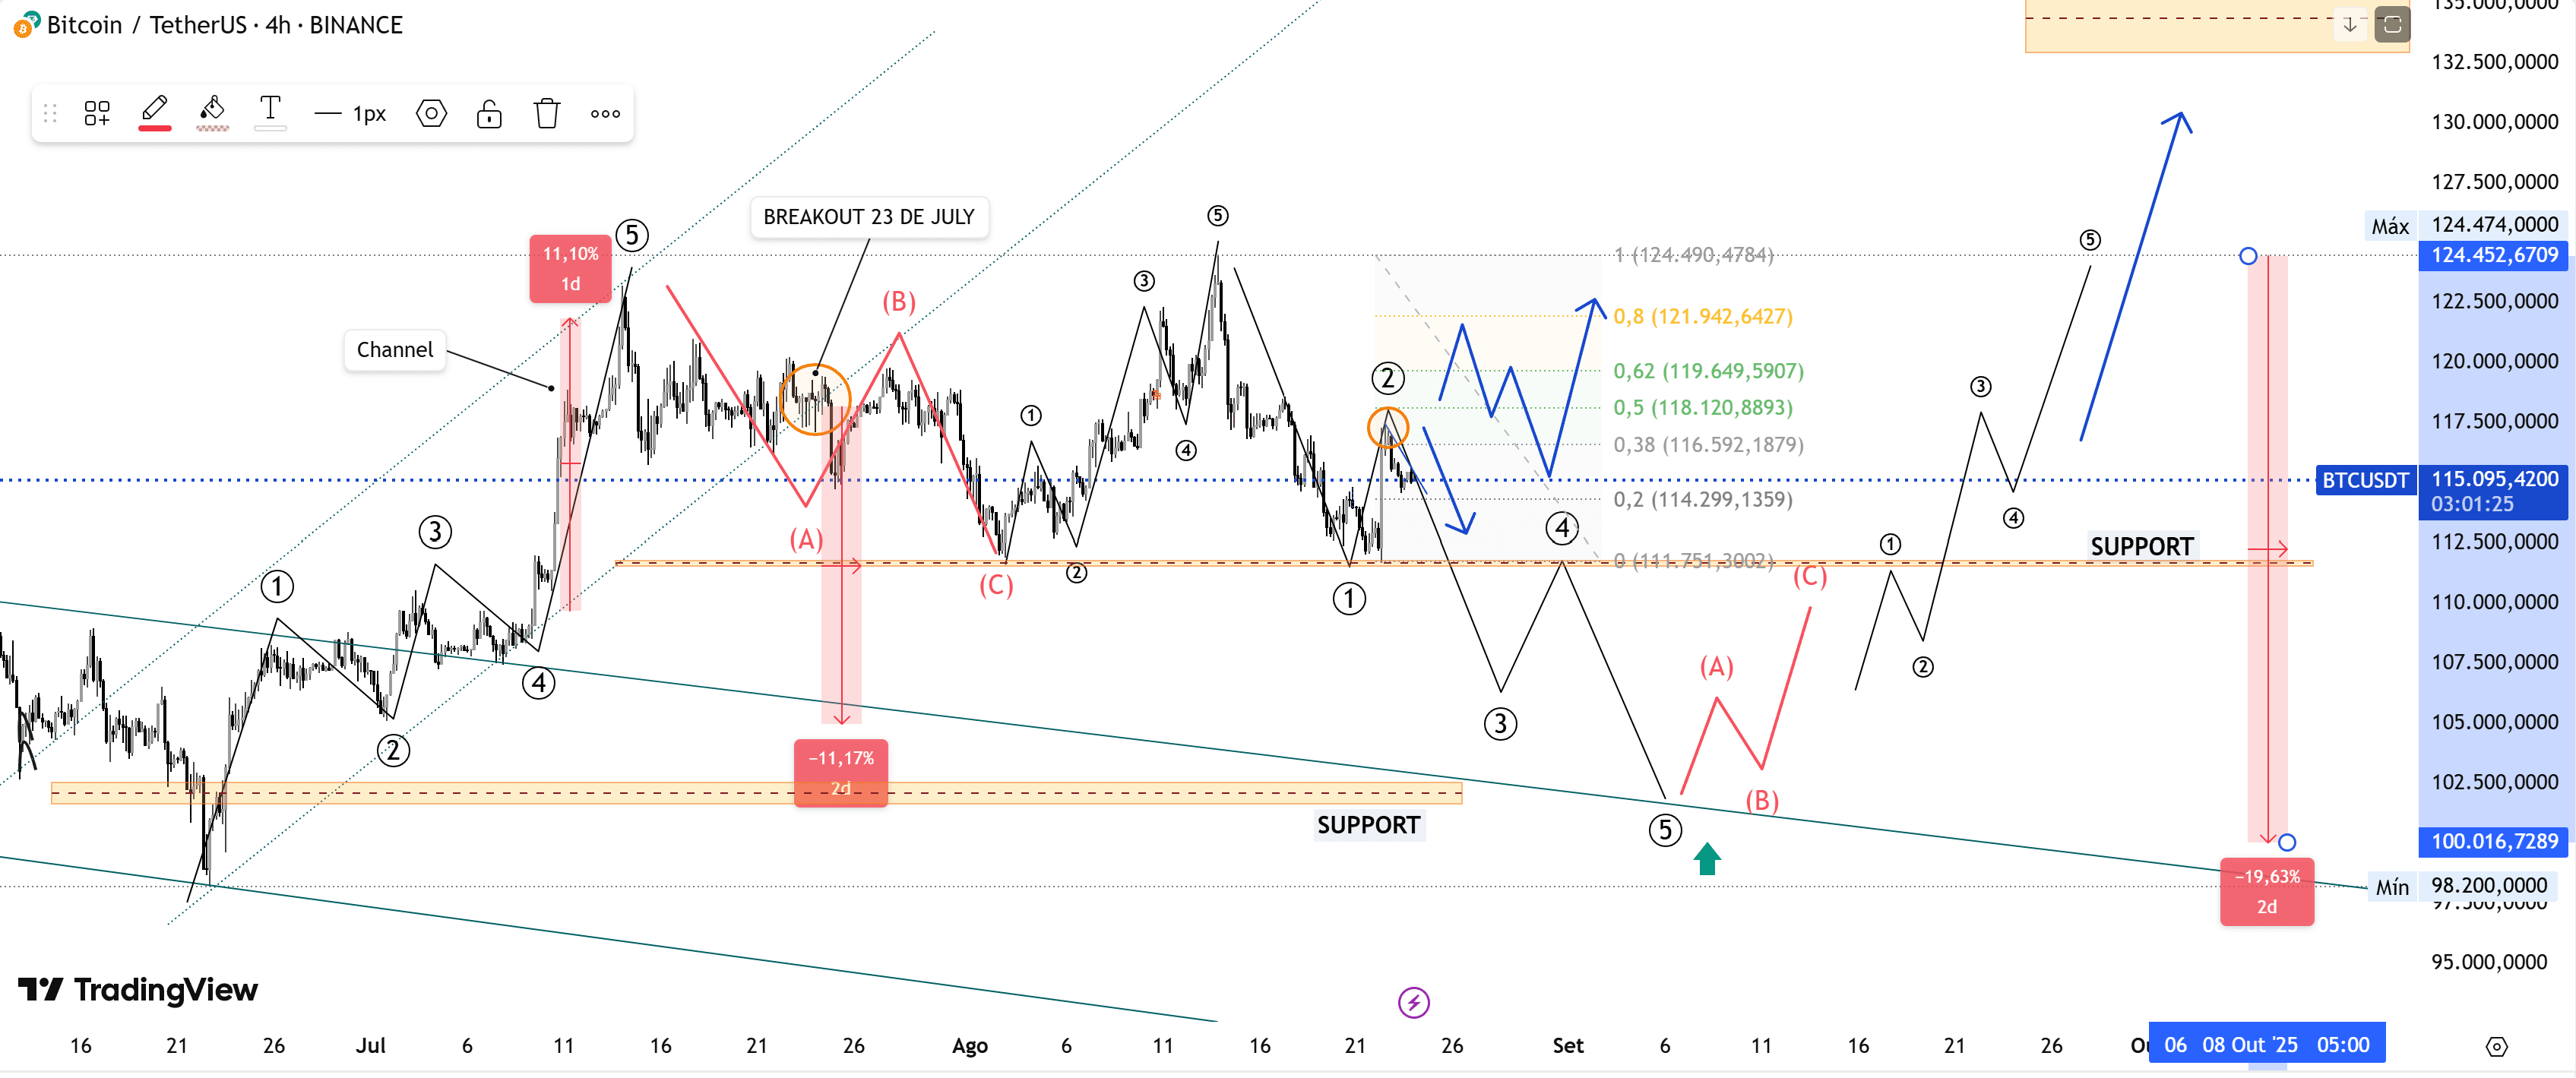
After breaking support, the first drop took the price to $111,900. Then, there was a temporary recovery that pushed BTC up to $124,474, marking a new all-time high. This movement was only a retest below the broken channel. Shortly after, selling pressure returned to dominate, forming a new bottom at $111,700, before a rebound to $117,400, a point that coincides with the 0.5 Fibonacci retracement of the corrective wave at $118,200.
This behavior reinforces the classic scenario of Elliott Waves: where BTC would have already completed the initial phases and would be entering the 3rd wave down — usually the strongest and most extensive.
👉 Confirmation will come if the price breaks the bottom at $111,700, accelerating the drop towards targets at $107,500 → 3rd Wave
If BTC breaks and holds above $118,120, the bearish scenario loses strength and may start a new bullish leg with targets at 120k → 124,474 → 130k+. If it breaks but quickly falls back below 118,120, it will just be liquidity collection, and losing 117,400/111,700 reignites the correction. It is also possible for the price to rise, pull back, and lateralize between 112k and 124k, accumulating strength before breaking upwards. Above 124,474, it opens space for extension up to 133k/138k. Below 111,700, the 3rd wave down towards 107,500–102,000 is confirmed.
📊 The risk of new drops remains high, especially because, after marking a new all-time high, Bitcoin began to lose important supports. If the movement intensifies, the price may seek $102,000 in search of liquidity, before attempting to resume the bullish trend in September.
📅 Seasonality: historically, BTC tends to correct in August until early September, before starting a new bullish wave, reflecting the cyclical behavior of investors and the market's liquidity dynamics.
Elliott Projection on BTC (Bearish Scenario)
Point 1: 118,000
Point 2: 111,900
Point 3: 124,474
Point 4: 117,400
Target: 111,500 (confirmation) → 107,500 → 111,500 → 102,000
#BTC #BearishSeason #ElliottWaves #CryptoAnalysis