To be honest, losing money in the crypto world is often not because you don't understand the indicators, but because you don't know who holds the chips. Especially with Meme coins, the most common trick is:
The project party hoards most of the chips;
Early-stage hype;
Retail investors rush in, then a high-level dump occurs, directly harvesting profits.
The reason you often become a bag holder is that you can't see the token distribution clearly.
The purpose of Bubblemaps is very direct: it helps you lay out the holding relationships, allowing you to see at a glance whether it's a whale-controlled market.@Bubblemaps.io
What exactly is Bubblemaps?
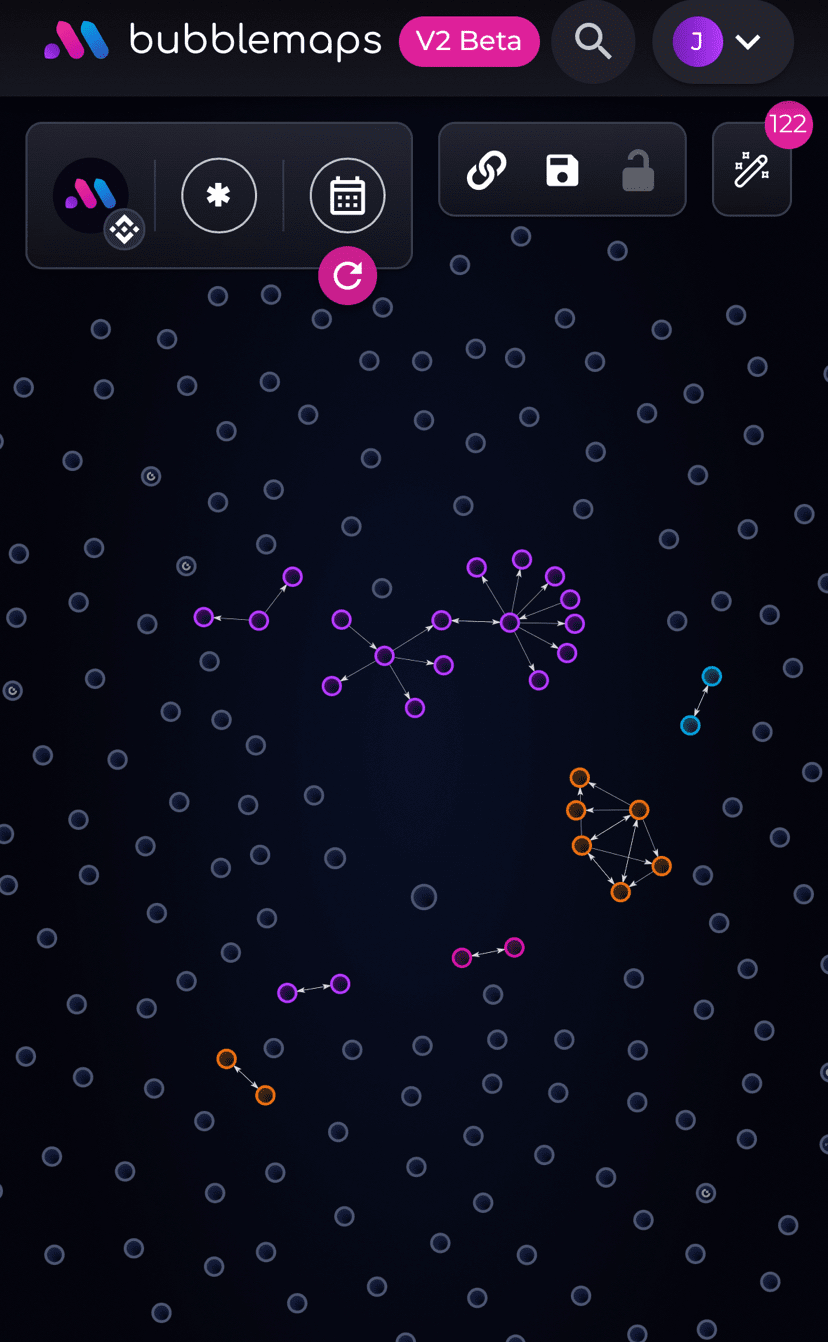
It is an on-chain data visualization tool that represents wallet data as a 'bubble chart':
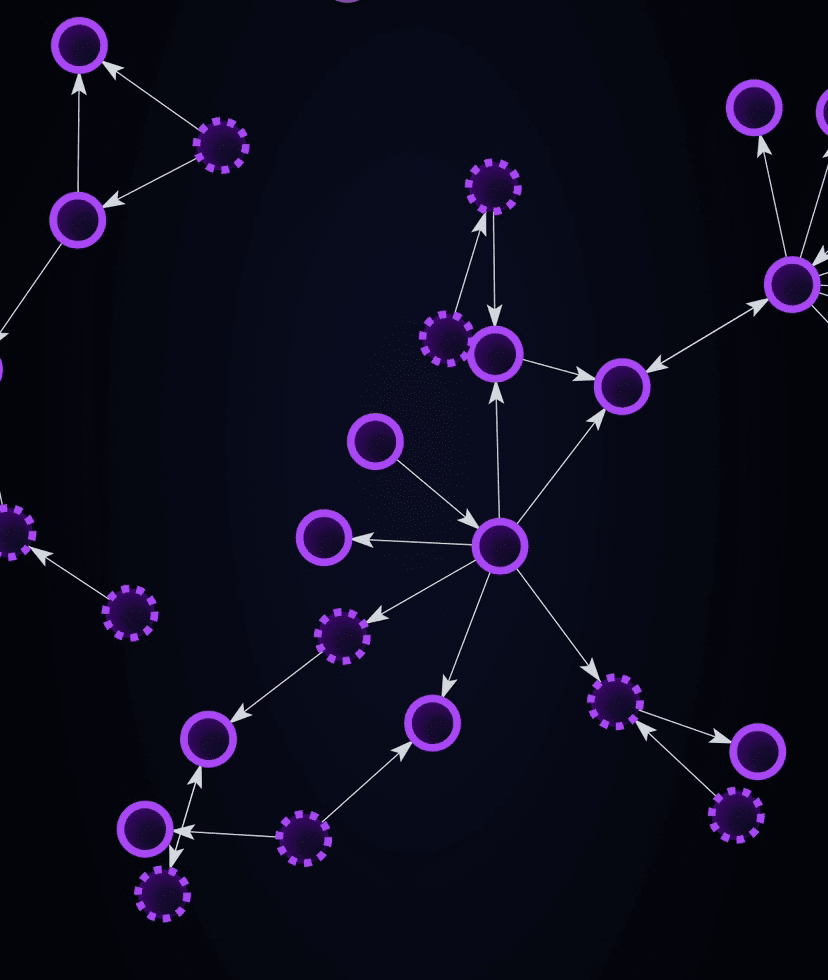
• Large bubbles: Large accounts
• Small bubbles: Retail investors
• Same color group: Capital group
• Gray bubbles: Independent players
• Lines: Back and forth transfer between wallets
• Dashed bubble: Clearing wallet
• 🔒: Lock-up or contract address (usually liquidity pool/team lock-up)
In short: It is not a prediction tool, but a chip distribution microscope.
[How should beginners use it? Detailed version]
When you first open Bubblemaps, many people will be confused, but the logic is simple, just follow these 5 steps:
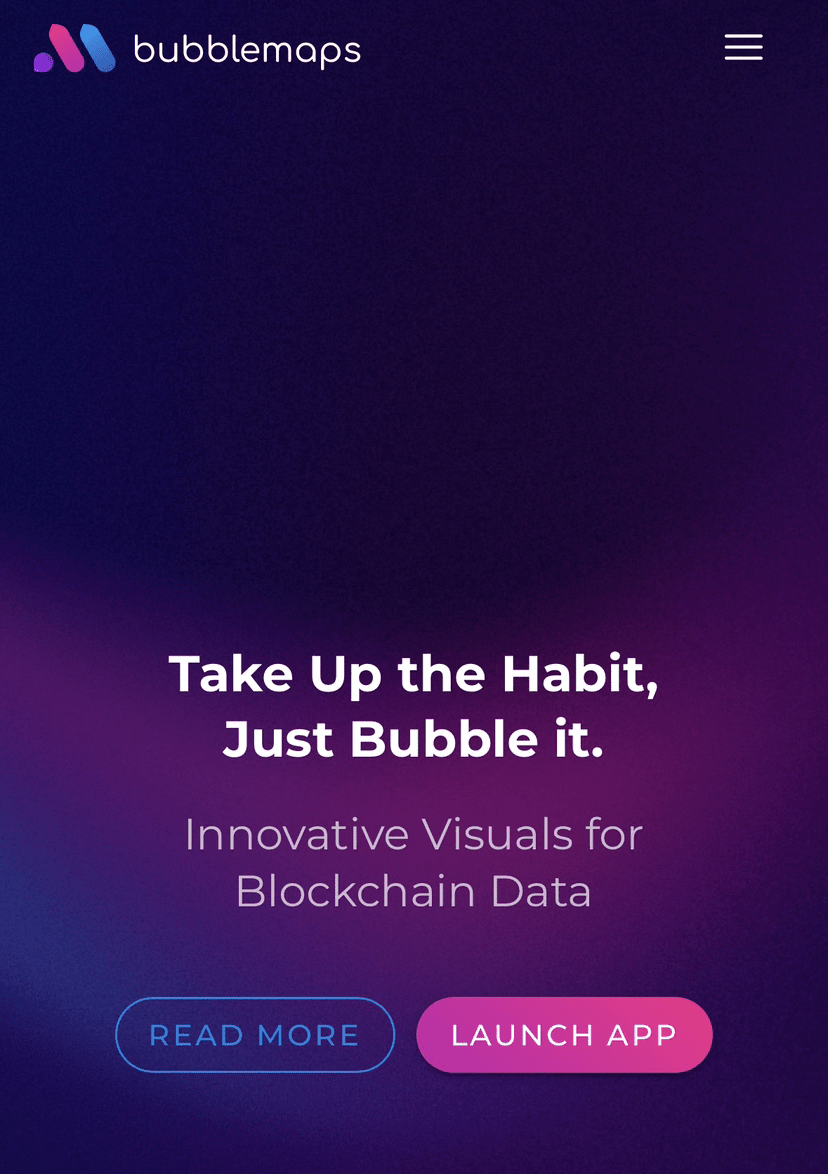
① Open the application
Open the browser and enter 👉 bubblemaps.io
You will see the homepage (like the screenshot), with two buttons in the middle:
READ MORE (See introduction)
LAUNCH APP (Enter application)
To use the function, click the pink button LAUNCH APP.
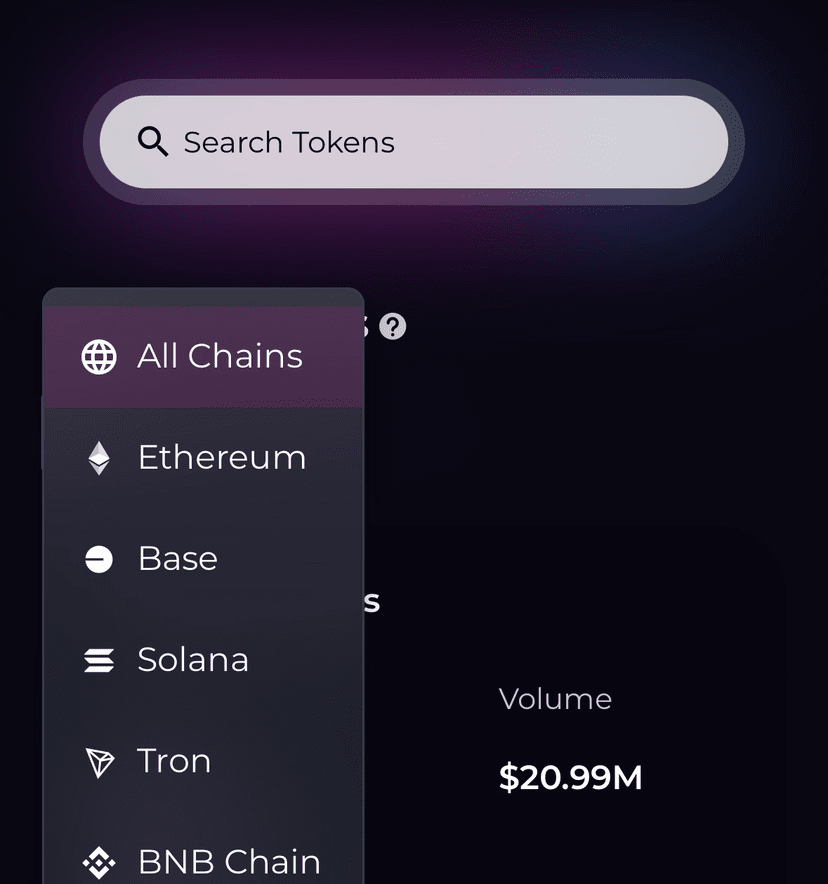
② Select Network
Select chain at the top of the page: ETH, BNB, Arbitrum, Polygon, etc.
👉 If you want to check a token, first select the chain it is on. For example, if a bunch of Memes are on BNB, then select BNB.
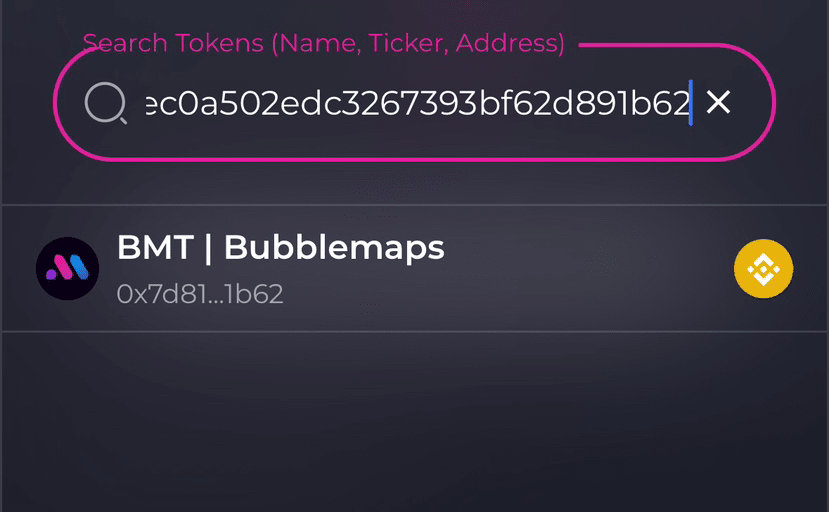
③ Enter the contract address
Paste the token's Contract Address in the search box.
⚠️ Never just search by name; there are many fake projects in the crypto world, names can be duplicated, but contract addresses are the only unique identifiers.
④ Read the chart
When viewing the chart, focus on the key points:
• Large bubbles → Large accounts
• Small bubbles → Retail investors
• Gray → Independent players
• Same color group → Wallet group, may be a whale
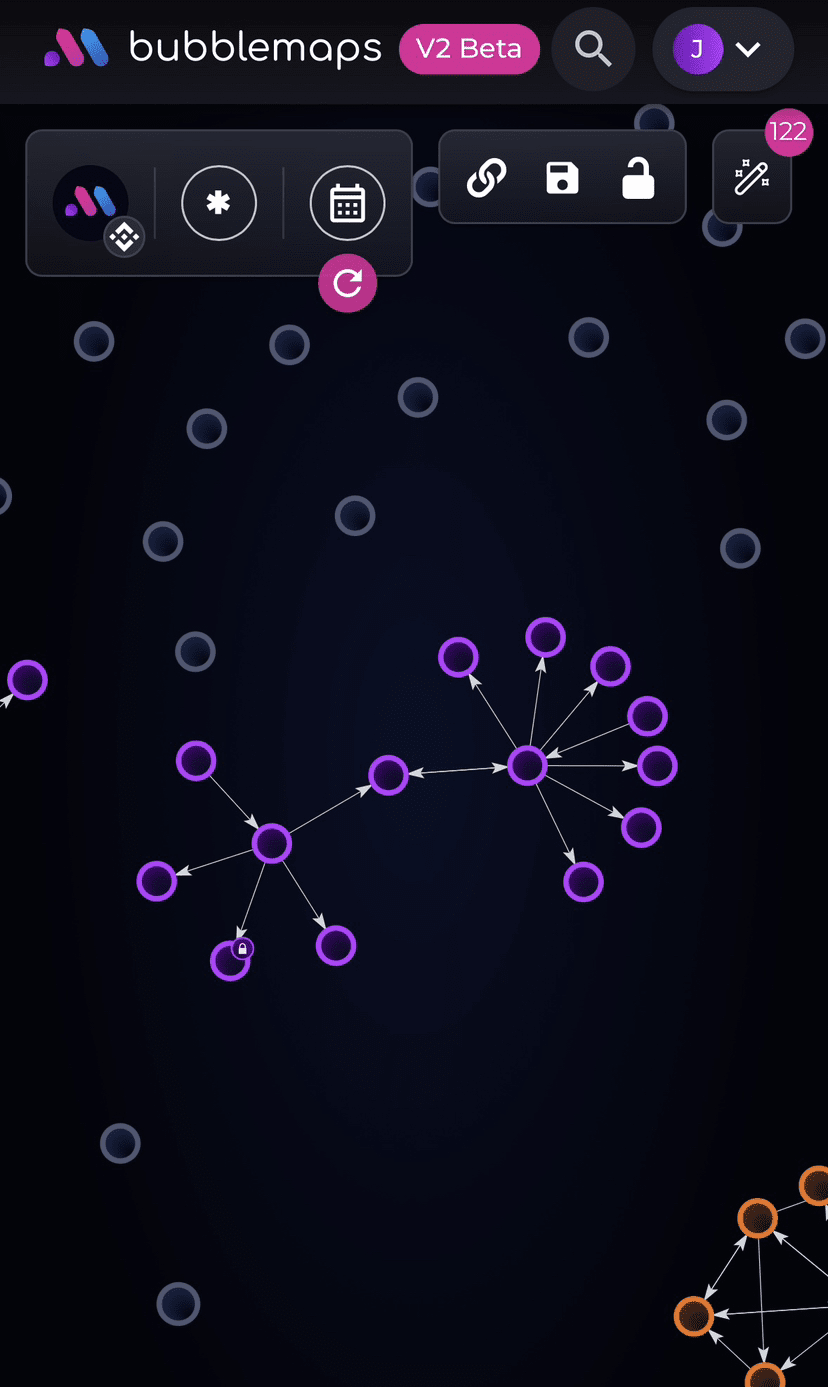
• Lines → Fund interaction between wallets
• Dashed bubble → Clearing wallet
• 🔒 → Contract/lock-up address, will not casually dump in the short term
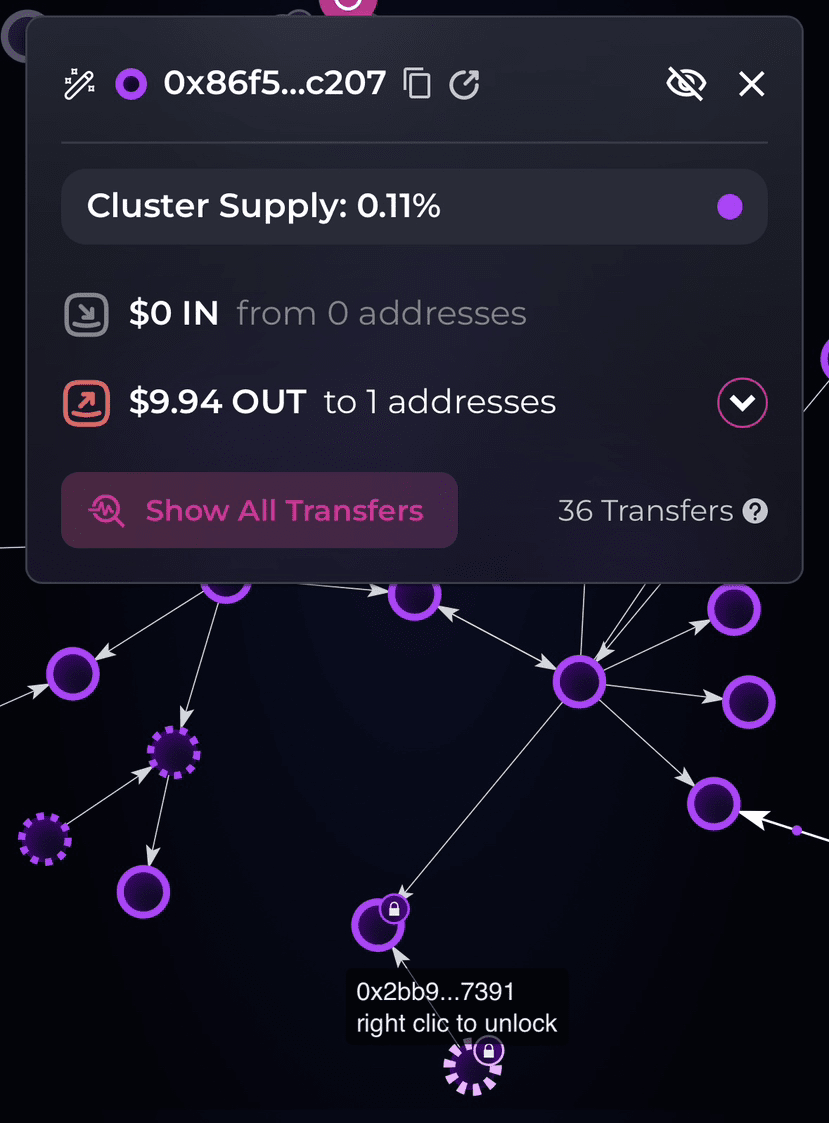
⑤ Quickly assess health
• Concentration: Are the top 10 wallets taking a large share? Over 70% → High control.
• Large holder relationships: Same color large group + dense lines → Typical whale scenario.
• Fund direction: Large accounts transfer to exchanges → Selling pressure signal.
• Lock-up situation: If the main chips are in 🔒 addresses, it is relatively safe in the short term.
As long as you follow these 5 steps, you can identify the market faster than 90% of retail investors.
Trader's advice
Bubblemaps won't tell you about price fluctuations, but it can tell you who can dump at any time.$BMT
In my opinion, there are two iron rules for trading:
1. Don't clash head-on with the whales.
2. Don't place bets when you can't see the chip distribution.
Next time someone shouts 'hundred times Meme', don't rush in; first use Bubblemaps to see the distribution, then decide whether to get in.


