#BinanceFeed Bollinger Band Indicator and its most important uses in financial markets
Happy New Year 🌹, and I thank you very much for your continuous support since the first article in the channel until today. Thanks to your following and encouragement, I continue to give and share my humble experience with you, to spread benefit, God willing.👇
Today we will talk about one of the most famous and widely used technical indicators in financial markets of all kinds: stocks, forex, and even cryptocurrencies. This indicator is the Bollinger Band.
What is the Bollinger Band indicator?
The Bollinger Band indicator was invented by financial analyst John Bollinger, and it is still alive today. The basic idea of this indicator is to measure whether the current price is high or low compared to its average.
The indicator consists of 3 main lines:
1. Middle line: which is a simple moving average (SMA) often over a period of 20.
2. Upper limit: equals the moving average + (standard deviation × 2)
3. Lower limit: equals the moving average - (standard deviation × 2).
👇
The standard deviation concept simply
The standard deviation measures how prices are scattered around the average.
If the deviation is large → it means that prices are volatile and far from the average.
If the deviation is small → it means that prices are stable and concentrated around the average.
-
What does the Bollinger Band tell us?
The indicator gives us two main pieces of information:
1. Volatility:
If the range (the distance between the limits) is narrow → the market is calm with weak volatility.
If the range is wide → the market is active with high volatility.
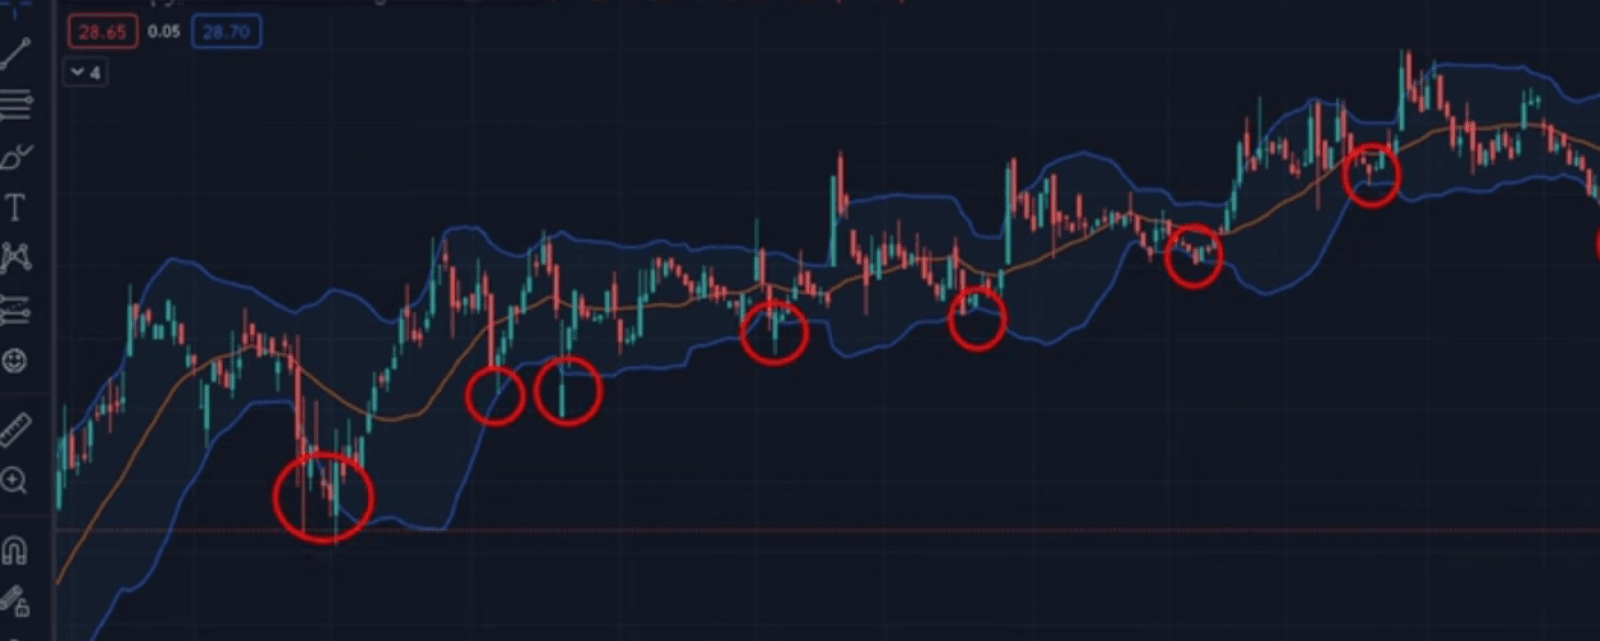
2. Price position relative to the range:
If the price touches the lower limit → there may be an upward opportunity.
If the price touches the upper limit → there may be a downward opportunity.
-
Common usage and widespread confusion
Many traders rely solely on the price touching the upper or lower limit to make a buy or sell decision directly, which is a common mistake. Because the price may continue to rise even after reaching the upper limit, or continue to fall even after reaching the lower limit.
The correct rule:
The Bollinger Band indicator is not used separately to give entry and exit signals; it is integrated with price action analysis or other indicators to confirm signals.
-
Summary
Bollinger Bands are a powerful tool for measuring volatility and determining whether the price is high or low compared to its average.
It gives a clear visual impression of price compression or price expansion.
However, it is not considered a magical or standalone tool; it should be integrated with other technical analysis tools such as support and resistance, candlestick patterns, or momentum indicators.
In short:
The Bollinger Band helps you read the market intelligently, but the final decision should be based on a comprehensive view of the market.
🔔 Don’t forget to support me by subscribing and following 👍, and sharing this post with your trading friends so that the benefit can reach everyone.
Every comment or contribution from you helps me provide stronger content and motivates me to continue 🙏