I have been trading for 10 years and have made a profit for 8 years! I have summed up the top ten trading rules. The words are short, but the content is significant. If you feel it is useless after reading, that's up to you!
Top Ten Trading Rules:
First, do not easily let go of low-priced chips; maintain your beliefs to prevent being misled by manipulators.
Second, chasing highs and cutting lows, going all in and out is always a big taboo. The big trend is favorable; gradually building positions during declines is lower risk, lower cost, and greater profit than chasing highs.
Third, allocate profits reasonably to maximize fund release instead of continuously increasing positions.
Fourth, during rapid rises, protect capital; during rapid falls, safeguard coins. Always maintain a correct mindset: do not speculate, do not be impulsive, do not be greedy, do not be fearful, and do not engage in unprepared battles.
Fifth, the low-priced chips in the front are based on experience and the speculation of the future of this coin by the funders. The subsequent secondary market games depend on techniques and information to follow the funds and should not confuse the two processes, leading to total confusion.
Sixth, when building positions and unloading, it is essential to layer and segment, gradually widening the price levels to effectively control the risk and profit ratio.
Seventh, familiarize yourself with the linkage effect; monitor the market while observing other currencies' movements. Each currency is not isolated in trading; seemingly unrelated movements are actually interwoven. Understanding the linkage effect with currencies is essential; many tools are available now to check currency information and news.
Eighth, positioning should be reasonable, with allocations between hot coins and value coins that consider pressure resistance and profit intake ratios. Being too conservative may lead to missed opportunities, while being too aggressive may face high risks! The greatest feature of value coins is stability, while hot coins are particularly volatile, which may rise dramatically or fall to zero in one shot.
Ninth, having currency on the market, money in the account, and cash in the pocket is the safest and most reassuring standard. One should not go all in; going all in is a sure way to die. Understanding risk control and reasonable allocation of funds is the key to determining your mindset and success.
Tenth, master basic operations, learn to extrapolate from one case to another, grasp basic trading thoughts, observation is the premise, remember each high and low point as reference data, learn to record, learn to summarize materials yourself, develop reading habits, and cultivate the ability to filter information.
From the perspective of trading mindset, selling is an ambiguous and often unpleasant task. However, once a coin reaches the selling condition, one should decisively let go; no one can always sell at the ideal position in the market. The selling position should not be pursued at a high level but rather at a reasonable level. Therefore, I will share with all retail friends the technical strategies and key points that have been proven over the past ten years, with a 90% probability of success!
The teacher tells you that trading volume in the cryptocurrency market is actually quite simple!
Hello everyone, today we are going to talk about trading volume, which is indeed very important but not as complicated.
You have probably seen these summaries about trading volume online: 'Volume-price rises together; the upward trend will continue'; 'Volume-price divergence in the upward trend is a reversal signal'; 'Price rises while volume shrinks, a downward trend is about to appear'; 'Volume-price slowly rises before a violent reversal' and so on.
These patterns are summarized well. However, for novice traders, they often find it hard to accept; it seems disconnected from reality, making it hard to remember and apply. So today, I will use a simpler approach to help everyone understand the essence of trading volume.
1. Volume-Price Analysis
We all know that the market price is formed by the continuous matching of transactions between buyers and sellers. When the sellers, that is, the supply side, have too many chips and throwing pressure is too great, the price falls; when the buyers, namely the demand side, continuously flood in and buying pressure is too great, the price rises.
In other words, the movement of price is entirely due to the ongoing divergence of supply and demand.
Behind every K-line, there are both buying volume and selling volume. Lacking either side means no transaction can occur. After understanding these basics, we will introduce our most important concept today. Once you grasp this concept, I believe volume-price analysis will become a piece of cake for you. So, what is this concept? It is 'effort and results.'
What does it mean? The so-called effort refers to trading volume, and the result is the extent of price increase or decrease under this effort. When there is effort and results, it is a normal phenomenon, which is volume-price confirmation; when there is effort without results, it is an abnormal volume-price situation that requires our attention.
We often say to look at trading volume; in fact, the research ultimately has only one purpose: to focus on when volume-price anomalies occur. Because at this time, the market may experience significant pullbacks or reversals.
Next, let’s further understand the concepts mentioned above by combining cases.
2. Case Analysis
1. Simple Cases
Let’s first look at case image 1. This is a bullish candle; below is the trading volume, and the white curve is the moving average of the trading volume. We draw this average line mainly to distinguish whether there is high volume or low volume.
Case 1: Single K-line
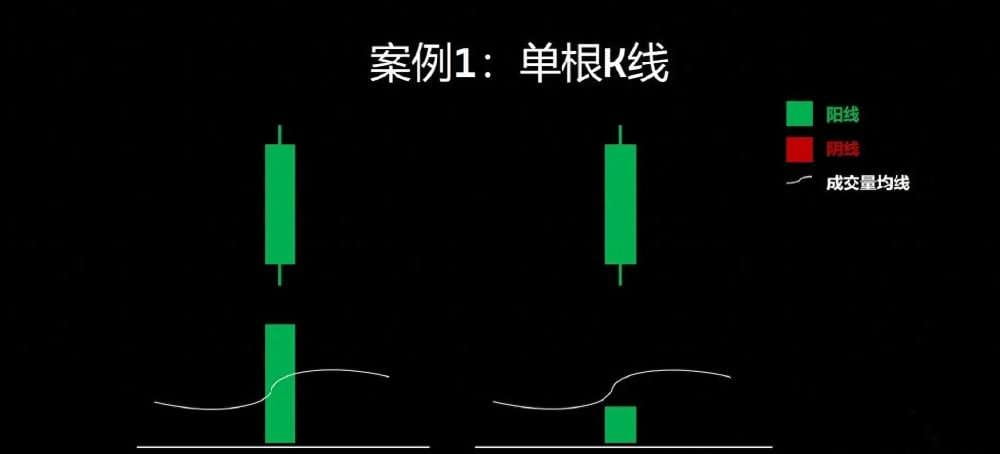
Figure 1
Let’s first look at the left side of Figure 1: a large bullish candle with high volume. Trading volume represents effort, while K-line represents result. The K-line opens at a low and closes at a high, with the closing price far from the opening price, forming a large high-low price difference, indicating a strong trend.
In short: Effort yields results, confirming volume-price.
Looking at the right side of this image, we see a large bullish candle, but with no high volume. Trading volume represents effort, while the K-line represents result. Although the K-line has a large high-low price difference, the trading volume indicates that it simply did not make an effort. Why would there be such good results?
In short: No effort with results indicates abnormal volume-price.
Let’s continue to look at case image 2.
Example 2: Single Phase K-line
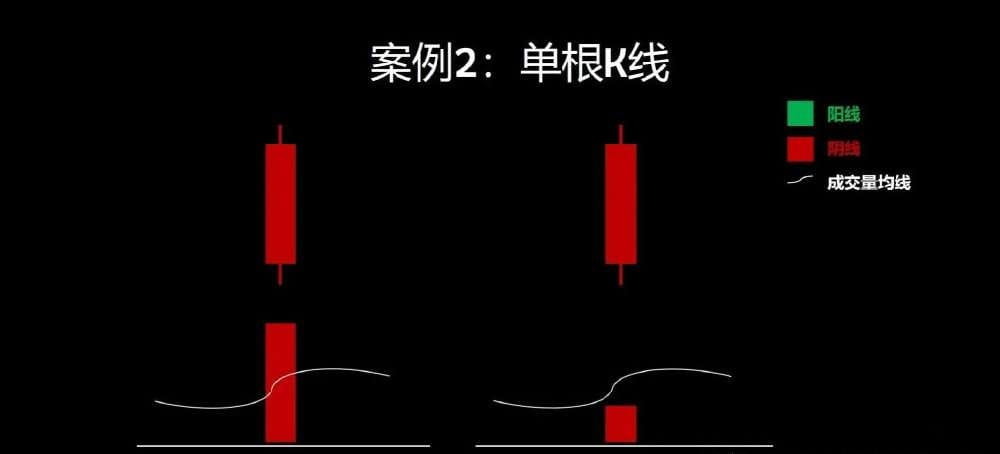
Figure 2
Look at the left first, a large bearish candle, with high volume. Trading volume represents effort, while K-line represents result. The K-line opened at a high and closed at a low, with the closing price far from the opening price, forming a large high-low price difference, indicating a strong trend.
In short: Effort yields results, confirming volume-price.
Let’s look at the right side of this image, a large bearish candle, with no high volume. Trading volume represents effort, while K-line represents result; although the K-line has a large high-low price difference, it simply did not make an effort. Why would there be such positive results?
In short: No effort with results indicates abnormal volume-price.
Next, let's look at case image 3.
Case B: Single K-line
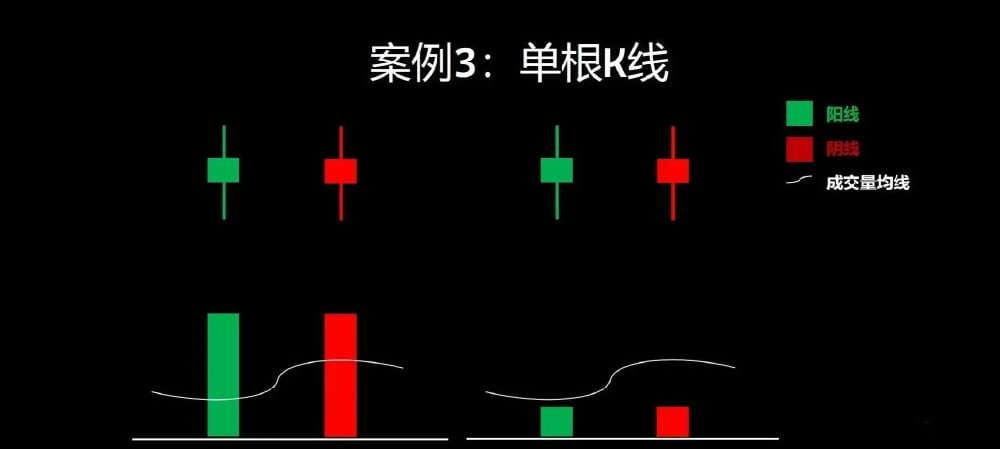
Figure 3
Let’s first look at the left side: a small body, with the opening price close to the closing price, and a small high-low price difference, but strangely, there is large volume. Trading volume represents effort, while the K-line represents result. If the market has made such a large effort, why has the K-line hardly moved? There is neither a significant rise nor a significant drop.
In short: effort without results indicates abnormal volume-price.
Let’s look at the right side again. Small body, opening price close to closing price, small high-low price difference, no trend, but the corresponding trading volume is indeed not large. No effort means no results, which is normal.
In short: no effort, no result, confirming volume-price.
Next, let’s look at case image 4.
Case 4: Single K-line
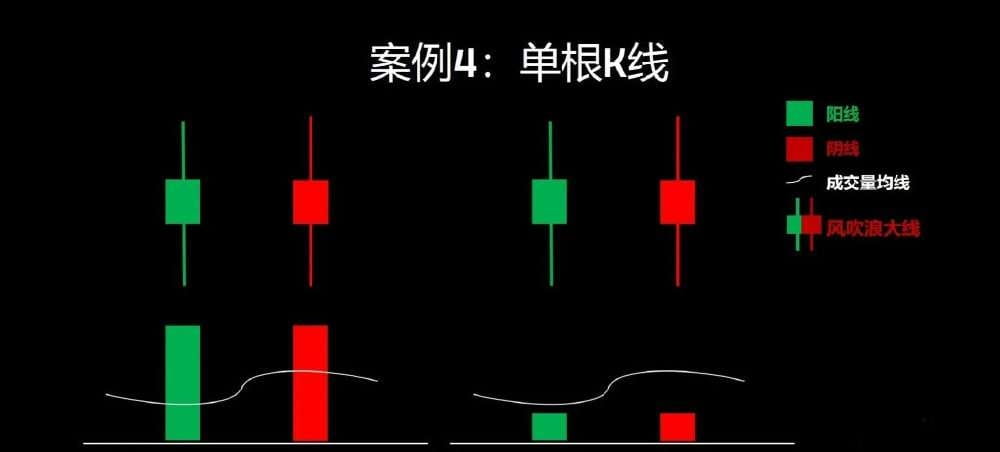
Figure 4
Although it is very similar to case 3, there is actually an essential difference.
The illustration on the right tells us that this K-line has a large amplitude (amplitude does not equal price change) with long upper and lower shadows.
The underlying meaning is that both the bulls and bears (supply and demand) once engaged in fierce competition here, and in the end, neither could defeat the other, resulting in a large body with long upper and lower shadows.
Now let's look at the group of images on the left. The trading volume is large, and the K-lines show that the bulls and bears are competing fiercely, with the price experiencing violent movements. Trading volume represents effort, while K-line represents result.
In short: Effort yields results, confirming volume-price.
Let’s look at this group of images on the right. The K-lines are still fluctuating violently, but the trading volume is very small.
In short: No effort with results indicates abnormal volume-price.
Through the previous four cases, I believe you have understood what 'effort and results' mean; what 'volume-price confirmation' means; and what 'volume-price anomalies' mean.
2. Complex Cases
Next, let’s look at some slightly more complex cases. Please note that we mentioned earlier! We study trading volume to discover anomalies. When volume-price anomalies occur, it is time to pay attention because the market may experience significant pullbacks or reversals.
Let’s look at case image 5.
Case 5: Multi-phase
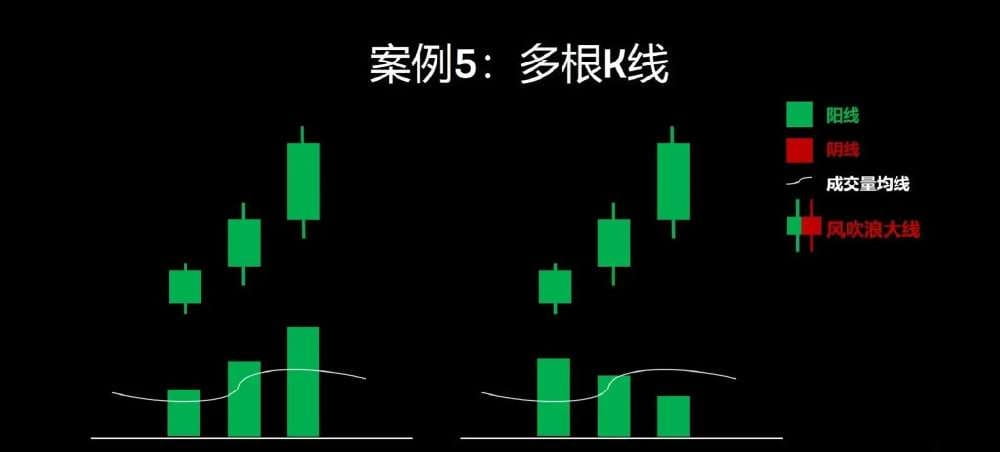
Figure 5
First, look at the left side of this group of images. This is a rising trend. Three bullish candles successively raise the price, and the extent (high-low price difference) of the three bullish candles also changes from small to large. Next, we look at the corresponding trading volume; does it also change from small to large with the extent of the bullish candles? Therefore, we say this wave of rise is effort with results.
Volume-price confirmation, or volume-price rising together, price up and volume up.
But let’s focus on this group of images on the right. Three bullish candles successively raise the price, and the extent (high-low price difference) of the three bullish candles also changes from small to large. However, let’s pay attention to the trading volume.
The first K-line has the smallest high-low price difference, but the trading volume is the largest: the second K-line's upward movement is significantly greater than the first K-line, but the trading volume compared to the first K-line has clearly decreased; looking at the third K-line, the upward movement is relatively the largest, but the trading volume is the smallest.
In short: This rising trend shows effort with results, indicating abnormal volume-price. This is what we often refer to as volume-price divergence, where price rises while volume shrinks.
Using the same logic, let’s look at case image 6.
Case 6: Multiple K-lines
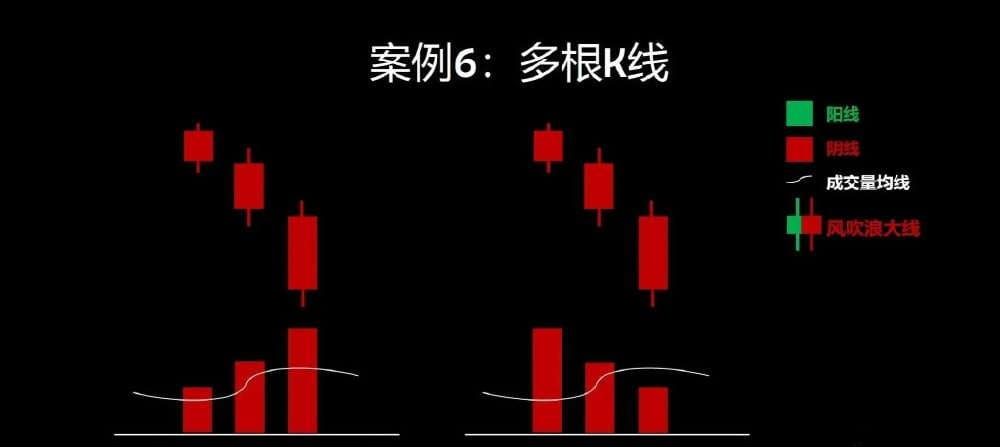
Figure 6
Look at the left side of this group of images; this is a downtrend. Three bearish candles successively pull the price down, and the amplitude (high-low price difference) of the three bearish candles also changes from small to large. Next, we look at the corresponding trading volume, which also changes with the amplitude of the bearish candles.
Thus, we say this wave of decline is effort with results, confirming volume-price. Or, price falls while volume increases.
Next, let’s focus on this group of images on the right. Three bearish candles successively pull the price down, and the amplitude (high-low price difference) of the three bearish candles also changes from small to large.
However, let’s pay attention to the trading volume: K-line 1 has the smallest movement amplitude compared to the other two K-lines, but the trading volume is the largest; K-line 2's decline is significantly greater than K-line 1, but the trading volume compared to K-line 1 has clearly decreased; looking at K-line 3 is even more obvious, with the largest decline, but the trading volume is relatively the smallest.
In short: this downtrend belongs to no effort with results, indicating abnormal volume-price. This is what we commonly refer to as volume-price divergence or price dropping while volume shrinks.
By now, I believe you have learned how to detect 'volume-price anomalies' in advance; let’s now look at some real market cases.
3. Real Market Cases
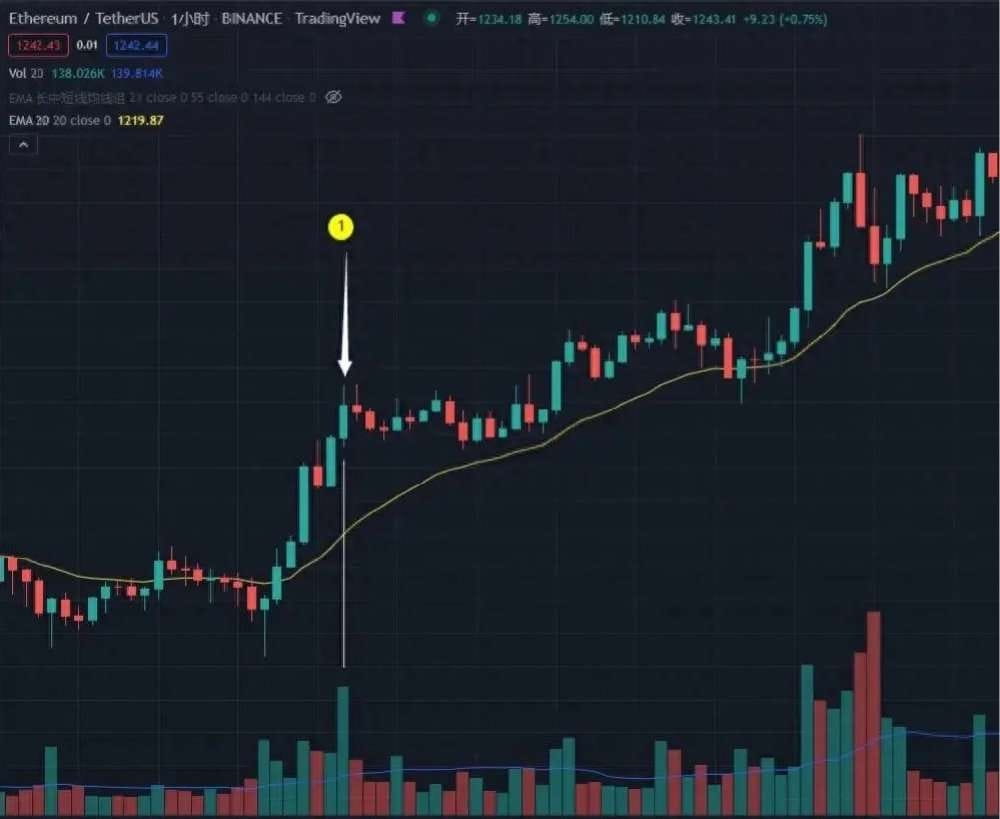
Figure 7 is the 15-minute chart of the ice sugar orange on Binance's spot chart.
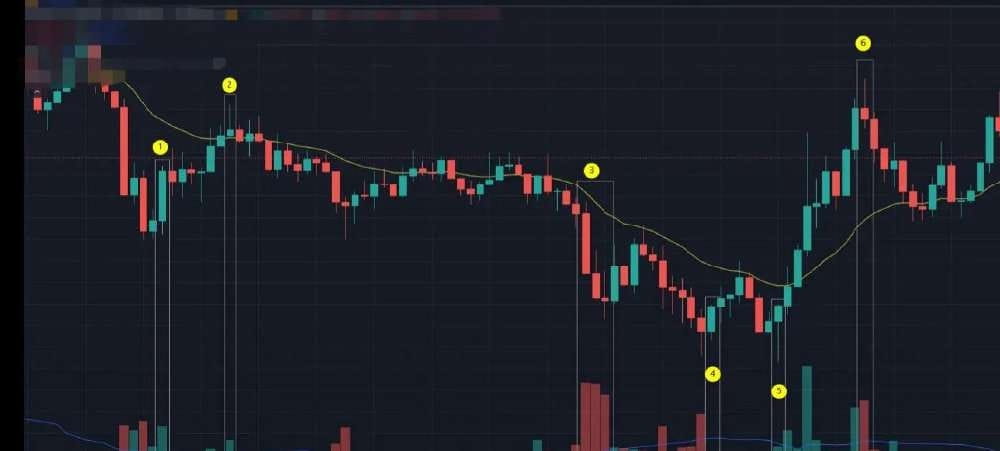
Figure 7
Let’s first look at K-line 1. The amplitude (high-low price difference) is much larger than the previous bullish K-line, and the trading volume is also significantly larger than the previous K-line. Effort yields results, confirming volume-price, and the trend is running very healthily.
Next, let’s look at K-line 2. Note that K-line 2 has the largest trading volume among these three bullish candles, but it failed to successfully push the price higher, and the high-low price difference (increase) is the smallest among these three K-lines. This indicates effort with results, but the volume-price situation is abnormal.
The underlying reason is that at this point, the supply side's strength is greater than the demand side's strength. Even if you do not attempt to short, should you consider reducing or closing your long positions?
Let’s look at the K-lines at position 3. The amplitude of the bearish candle is continuously shrinking, yet the trading volume is continuously increasing. In other words, despite such a large effort (trading volume), why are the results (K-line amplitude) not good? Effort without results indicates abnormal volume-price that needs close attention.
In our lessons on Wyckoff, we also discussed this: it is clearly due to the appearance of a large number of opposing positions, meaning that the supply side encountered buying pressure from the demand side here, which led to the situation of effort without results.
Next, look at K-line 4. The amplitude of the K-line is significantly larger than that of the previous bearish candle, but the trading volume is even less than half of that of the previous bearish candle. No effort, no results, indicating abnormal volume-price. Or, one effort yields two rewards.
Whenever this situation occurs at the end of a downtrend, we must be cautious. As the supply side gradually loses strength, there is little left to sell, or supply is exhausted, so the demand side can easily raise the price with minimal effort, which is what we refer to as one effort yielding two rewards.
At this point, the demand side can easily dominate the market. We need to be vigilant as the market may reverse. We should closely observe how the demand side follows up and should not give up too early.
Next, let’s look at K-line 5. Although the body is not large and the high-low price difference is not great, its amplitude is not small. However, the corresponding trading volume compared to the previous K-lines can’t be considered large. So we conclude: effort without results indicates abnormal volume-price.
At this time, combining what we previously learned about support and resistance levels, as well as the SB structure in price action, the Wyckoff theory of shakeout behavior, the Pinbar in the 12 Golden K, and the concepts of signal K-line and entry K-line, etc., these practical methods.
Do you find that many indicators and signals resonate here? Thus, K-line 5 is a good entry point for going long.
Set the take profit near the previously mentioned K-line 2, as this is the upper tight track, once again validated as a resistance level by K-line 2; there must be many bears (supply side) waiting here.
Finally, let's look at K-line 6. It is a strong bearish signal K-line; compared to the previous two bullish candles, K-line 6 also made an effort (with large volume) and attempted to raise the price but failed.
Effort without results indicates abnormal volume-price. Coupled with the current pressure level, even if we don't short, shouldn't the bulls reduce or close their positions?
So why did it fail here? As mentioned earlier, it’s because this is an important resistance level, and many smart money from the bears is lying in wait to short.
Thus, when the price runs to this point, although the demand side is strong and seems to be about to break through, the supply side is unexpectedly even stronger, giving the demand side a wake-up call. Eventually, this leads to effort without results, so we need to be vigilant!
Learning about trading volume is not that complicated; the main goal is to keep an eye out for volume-price anomalies. For at this time, the market may experience significant pullbacks or reversals. Trading volume is good, but it is not a holy grail. It also needs to be used in conjunction with other technical analysis methods.
The above two points determine that the weapon of trading volume can only assist us in reading charts; it can help us understand market supply-demand relationships more deeply and comprehensively, but it cannot directly serve as our entry trading signal.
What does it mean? For example, let's look at case 1.
Figure 1
Let’s pay attention to K-line 1; it appears in a bullish trend background with large volume (effort) and also closes as a bullish candle. However, compared to previous bullish candles, even if we see that K-line 1 is effort without results, can we immediately enter and short?
Of course not; this is clearly using trading volume as an entry signal. I just want to tell everyone to keep an eye out when there are volume-price anomalies and be extra cautious; this does not mean to enter the market directly.
Next, we will begin to learn the key points of trading volume:
1. The combination of trading volume and trend;
2. The combined use of trading volume and 12 Golden K.
1. The combination of trading volume and trend
Let’s first look at the first part, the combination of trading volume and trend. We will discuss it from both supply testing and demand testing.
1. Supply Testing
Teaching Case
Let’s first look at an illustrative image (Figure 2).
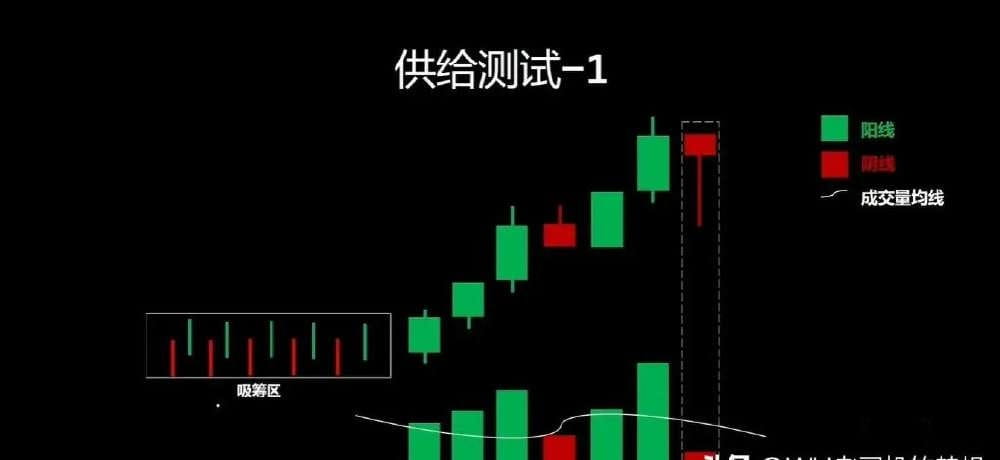
Figure 2
Let’s pay attention to this bearish candle within the dashed frame; putting aside the trend context, we look at this K-line alone. The high-low price difference is small, and the trading volume is also small, indicating no effort, no result, which is a normal volume-price situation.
Next, let's look at the position where this K-line appears, which is at the top of a rising trend. It is actually telling us: as the price continues to rise, there is indeed some supply force (sellers) at a high level in the market. Because we see that the bears attempted to push the price down but failed and were pulled up by the bulls, resulting in a long lower shadow.
What’s more noteworthy is that there was not a large trading volume behind this competition. In our last lesson, we discussed that behind a K-line there are both the buying volume and the selling volume; lacking either side means no transaction can occur.
Thus, to summarize, looking at this K-line alone indicates volume-price confirmation; it is not an abnormal volume-price situation, so we do not need to pay special attention. However, combining with the context reveals that this K-line wants to tell us that there is indeed selling pressure; however, this selling pressure is not strong enough to pose a threat to the existing bullish trend, allowing us to hold our positions with peace of mind.
Let’s refer to the above situation as supply test confirmation or normal supply testing.
Next, let’s look at the second situation (Figure 3). The body is still very small, but the trading volume is large.
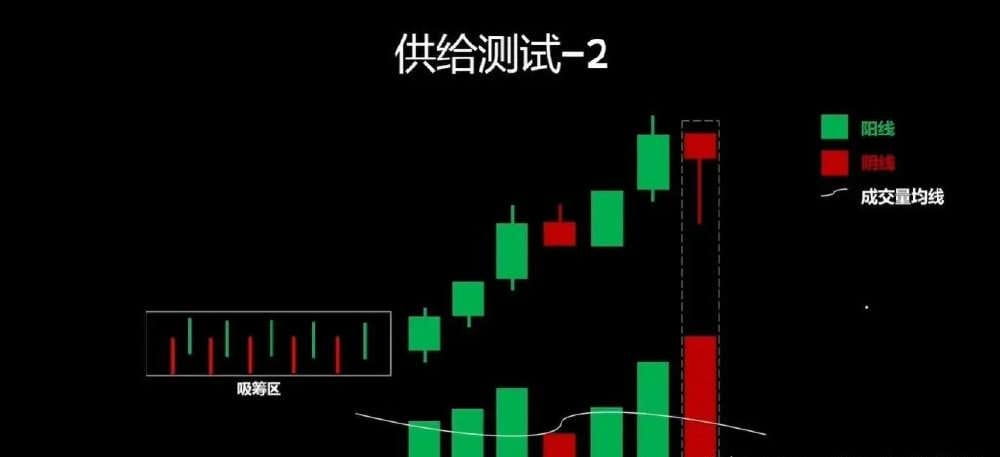
Figure 3
As a rule, let’s first analyze this single K-line apart from the trend. The high-low price difference is small, but the trading volume is large, indicating effort without results, an abnormal volume-price situation that requires our special attention.
Next, we combine the background and find that this K-line wants to tell us that there is indeed selling pressure at this position, and this selling pressure is quite strong. The reason for the long lower shadow is that the bulls below are also very strong and have consumed all the supply above.
At this time, some might question: Since it has already been consumed, can we relax? Why do we still need to pay special attention?
A thousand-mile dike collapses due to an ant's nest. Although this large number of supply sides was consumed by the demand side below, what if it appears a second time? A third time? A fourth time? Will the demand side still be so strong?
To summarize, although this K-line still superficially announces the victory of the bulls, it is actually telling us that initial supply has begun to emerge. If the subsequent strength of the bulls cannot continue to exert force to digest all the selling pressure (supply) above, then the market is very likely to experience significant pullbacks or reversals.
Next, let’s look at the third situation (Figure 4).
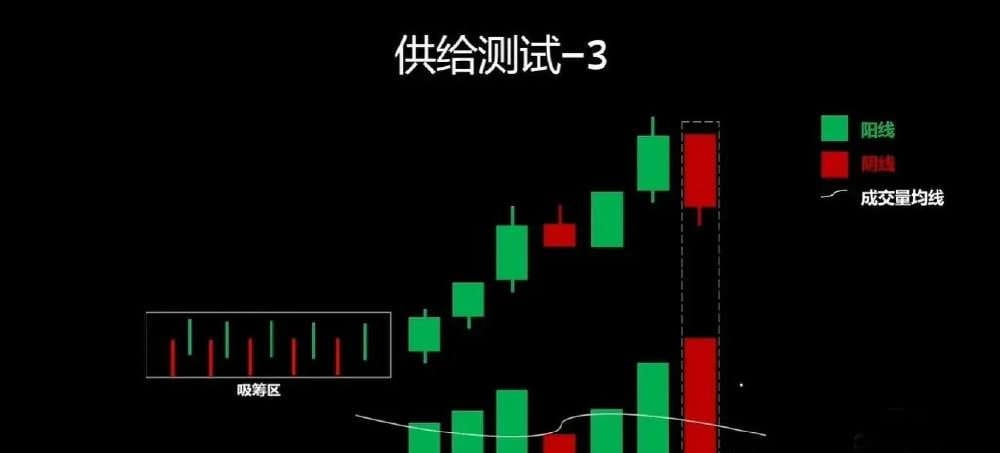
Figure 4
The same market background, but unlike the previous two, this bearish candle not only has a large volume but also a significant high-low price difference, swallowing the previous bullish candle.
This is actually telling us: this time the supply side not only has a great strength but also achieved results, effort yields results, confirming volume-price. This proves that there are not many demand sides (buyers) below who can digest all the supply (selling pressure) above, and the market may fall at any time.
In this case, we also refer to it as supply test exception.
At this point, some might not understand; didn't we just say that effort yields results and should be called volume-price confirmation? Why is it still called an anomaly? If you have studied our Wyckoff system course, you should understand, but I cannot simply explain it in one or two sentences here.
However, I want to tell everyone that names are not important, titles are not important; what matters is that we understand the essence of the market and know what the market is currently doing.
Next, let’s look at the last situation (Figure 5).
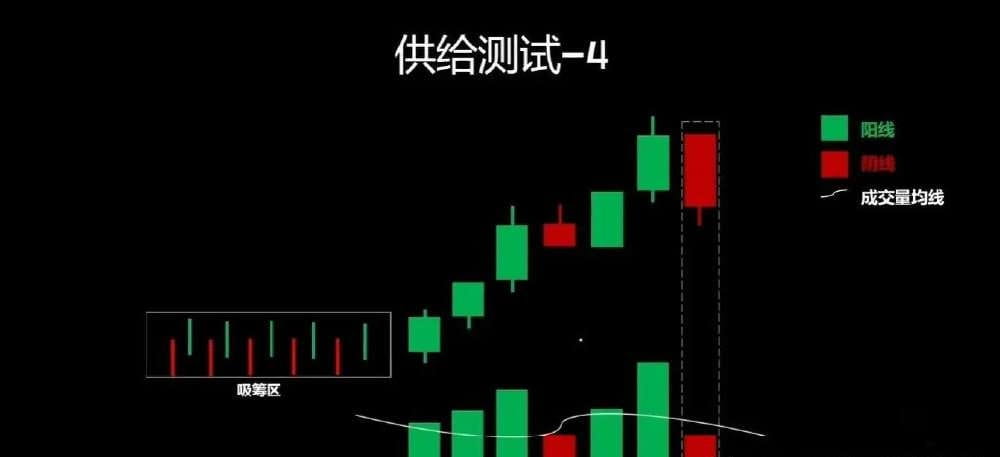
Figure 5
The high-low price difference of the K-line is large, but the trading volume is small. There is effort without results, indicating abnormal volume-price. We need to pay special attention. Why is there not so much supply at this time, but such a great harvest for the bears?
The corresponding result may be that it won't fall quickly, or even if it does fall, it will encounter the strength of the demand side at a certain support level and rebound quickly. There’s no need to panic excessively.
This situation can also be referred to as volume-price confirmation or normal volume-price.
Real Market Cases
Next, let’s look at a real market case (Figure 6) to verify what we just learned.
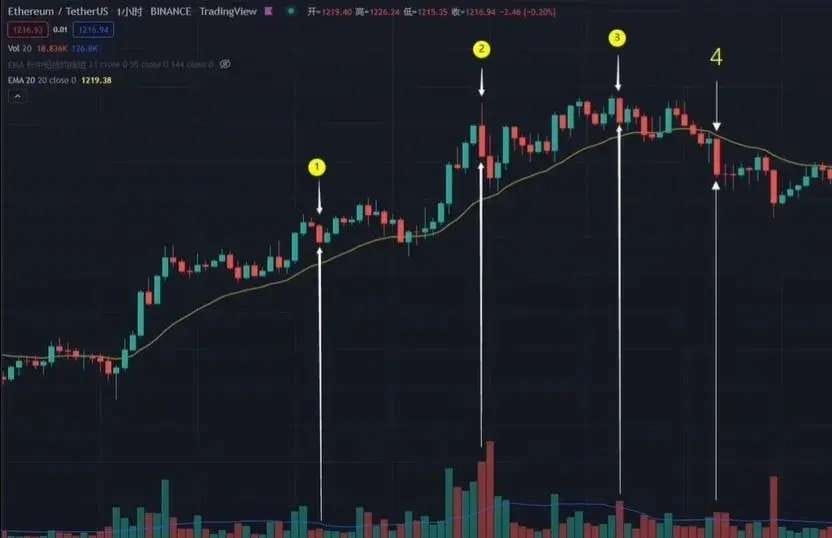
Figure 6
Let’s first look at K-line 1. Although it appears at the top of a rising trend and forms a bearish engulfing pattern with the previous K-line, its trading volume is very small, not exceeding the moving average of trading volume, and the high-low price difference is not large. Overall, it should be considered as effort without results, indicating volume-price confirmation and a successful supply test.
In essence, it is also telling us that although there is supply generated at this position, it has not yet posed a threat to the upward trend.
Next, let’s look at K-line 2. The high-low price difference is significantly greater than the previous two K-lines, and the corresponding trading volume is also large. Supply (bears) has both effort and results, indicating abnormal supply testing.
The market shows a large amount of supply at this point, and the demand side below does not have the capacity to digest all the selling pressure above, and the price may continue to fall at any time. Even so, it does not become an immediate short-sell signal.
Next, we look at K-line 3. We see that the market has just briefly declined at K-line 2 and then continues to rise, breaking through the high point of K-line 2. Although the upward trend continues, from K-line 2 to K-line 3, this rise is clearly characterized by price rising while volume shrinks, which we commonly refer to as divergence. Although divergence does not necessarily mean reversal, we need to pay special attention.
Thus, when we look at K-line 3 and K-line 4, although the corresponding trading volume is not particularly large, the high-low price difference of K-line 3 and K-line 4 is not small, indicating effort without results, which is an abnormal volume-price situation. Coupled with the background of divergence in the market.
Thus, we conclude that although the demand side once again defeated the supply side at K-line 2, the subsequent rise after K-line 2 is merely the last struggle of the bulls; without more demand entering the market, the price will naturally fall like a free fall. The bears only need to exert a little effort to achieve twice the result.
Therefore, K-line 2 is the position where initial supply has emerged. Once again proving that learning to find the emergence of initial supply in a running bullish trend is one of the essential skills for successfully escaping the peak in trading.
2. Demand Testing
Teaching Case
After understanding supply testing, let’s take a look at what demand testing means. Let’s first look at Figure 7.
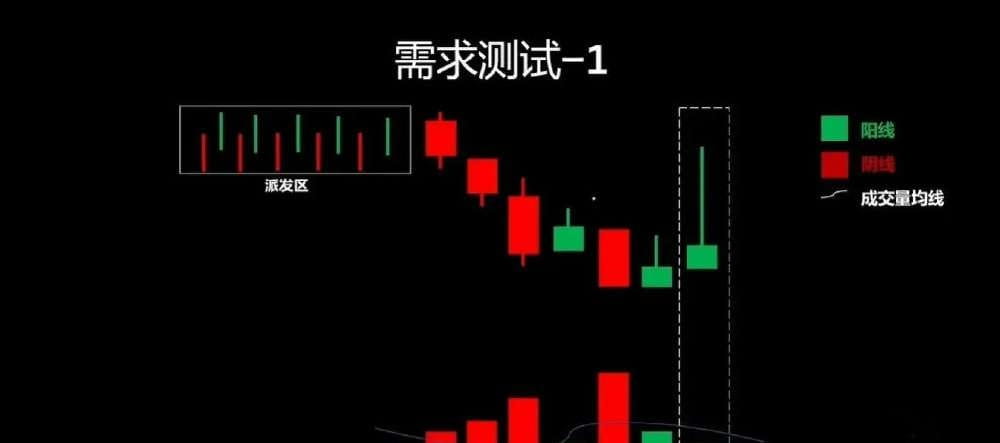
Figure 7
If the current market has just left the high distribution area and after a period of decline starts to show signs of rebound, we look at the K-line in the dashed frame. Although it ultimately closes as a bullish candle, the body is small, the upper shadow is long, and the corresponding trading volume is small. No effort, no result, which is normal volume-price.
This tells us that there is indeed demand pouring into the market at this price level, trying to raise the price, but unfortunately, due to the large supply pressure above, this effort was quickly suppressed, ultimately returning empty-handed. Coupled with the small trading volume, it further proves that this demand force is weak. This is good news for the currently dominant bears.
We can understand that the bears want to push the price down even lower, so before preparing for the next downward attack, they first poke upwards to see if there is more demand willing to buy in. If there is much demand, then it’s definitely not good news for the bears when they start to sell off, so we call this situation demand test confirmation.
Next, let's look at the second situation (Figure 8).
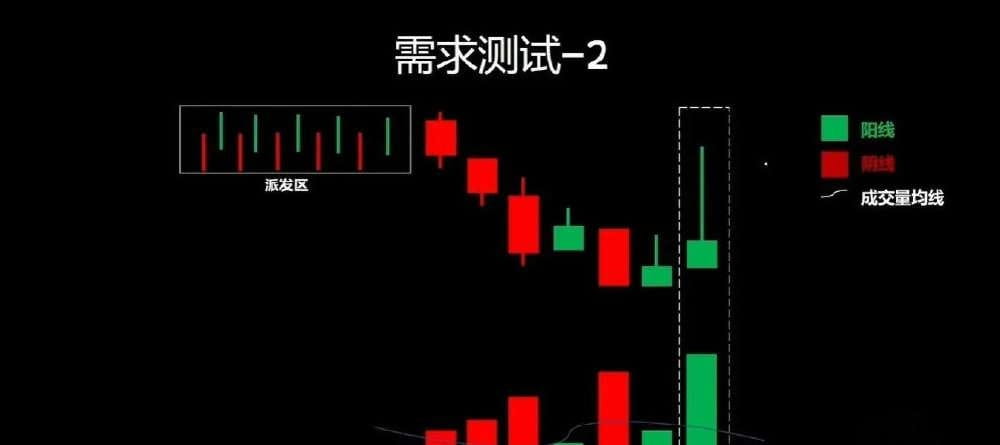
Figure 8
The overall background is the same as before, but let's pay attention to this K-line within the dashed white box. The high-low price difference is small, but the volume is large. Viewing this K-line alone shows effort without results, indicating abnormal volume-price situation. Coupled with the current market background.
We learned that it was because there was a large number of demand side appearing here, although in the end, due to the large supply pressure above, they were unable to achieve their wishes. But the fact is reminding the bears that initial demand has begun to emerge; they need to be cautious.
In this case, we call it a demand testing anomaly. Because for the currently dominant bears in the market, this is not the result they hope to see.
Next, let's look at the third situation (Figure 9).
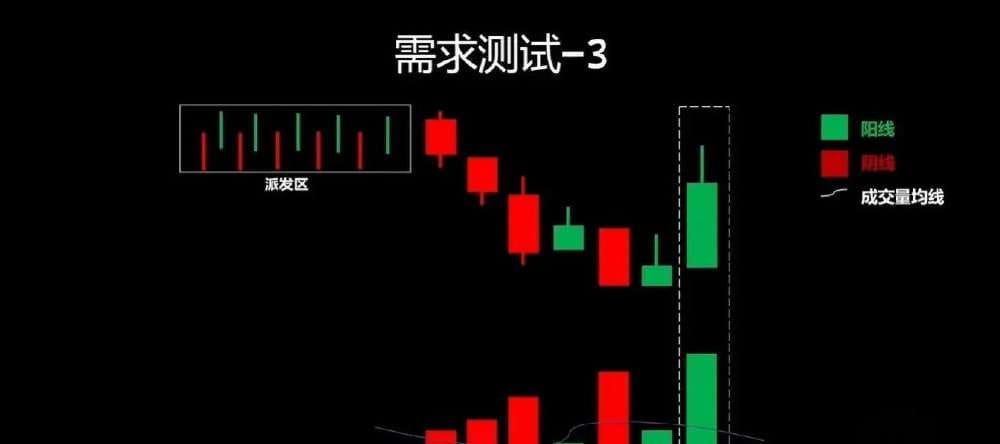
Figure 9
With the same market background as before, the difference is that this bullish candle formed a relatively large body and closed as a medium to large bullish candle. Moreover, the corresponding trading volume is also high, indicating that effort yields results, confirming volume and price.
This confirms that not only did the demand side's strength appear, but also that this strength temporarily held the upper hand, defeating the supply side's strength. Therefore, the price may test previous highs and even break through them. This is simply disastrous for the currently dominant bears.
Therefore, although looking at this bullish candle alone indicates normal volume-price, in the current bearish market context, this indicates demand testing anomalies. If we go short in accordance with the trend, we need to be particularly cautious, either reducing positions, closing positions, or preparing to build long positions.
Next, let’s look at the last situation (Figure 10).
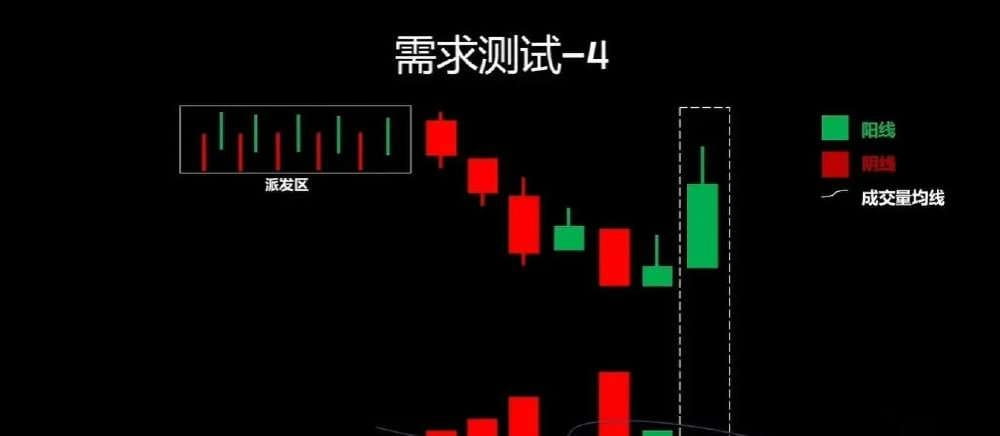
Figure 10
The same market background, but the difference is that this time the bullish candle closed as a medium to large bullish candle, yet the corresponding trading volume is small, indicating effort without results, an abnormal volume-price situation that requires our special attention.
Although we have previously mentioned that if a volume-less bullish candle appears at the absolute low of a bearish trend, it is a good thing. But this is based on the end of a downward trend, where there has been a long-term volume-price divergence, and supply is completely exhausted. It is time to sell everything. At this point, for the demand side, as long as they make a gentle effort, they can raise the price very high, easily resulting in a situation where one effort yields two rewards.
However, in the case of Figure 10, it seems that this is not the case. The price has just left the high distribution area, and the bearish pattern of the market has formed, indicating the early stage of a decline. Why does such a large volume-less bullish candle appear in the early stage of a decline?
Therefore, it is highly likely to be a kind of manipulation behavior by the main force, aimed at attracting more bulls to enter and continue to digest the main force's own supply, further completing the distribution purpose. So, this situation is demand test confirmation for the currently dominant bears. Be cautious about chasing long positions.
Real Market Cases
Similarly, to help everyone better understand, let’s look at a real market case (Figure 11), trying to connect as much knowledge related to demand testing as possible.
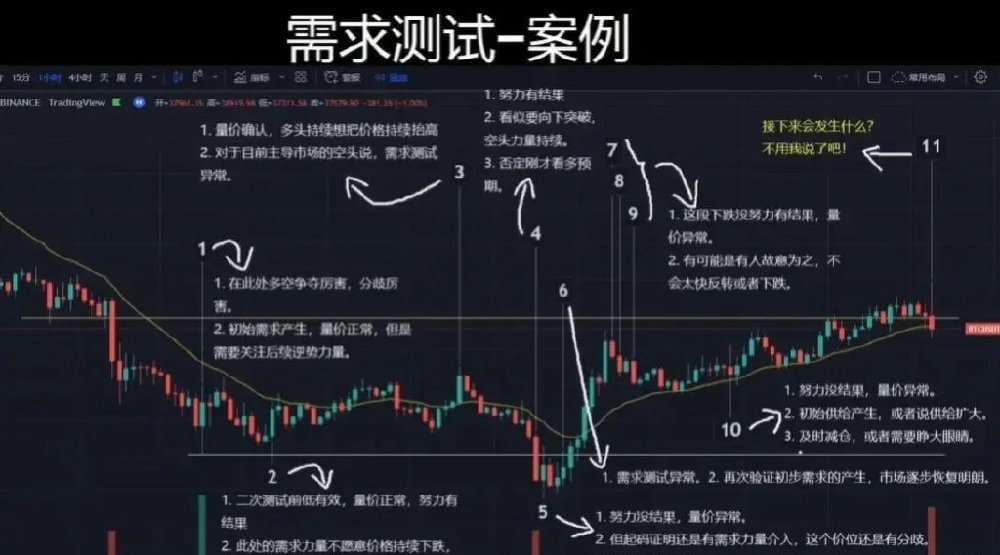
Figure 11
Due to time constraints, I will not explain this case in detail. I have written out the reading logic above, and the annotations are very clear. I suggest everyone save it; you can also ask me for a high-definition image.
This is the first major topic of our lesson today: the combination of trading volume and trend.
As long as you understand all the content we just discussed, the next topic: the combination of trading volume and 12 Golden K will be straightforward.
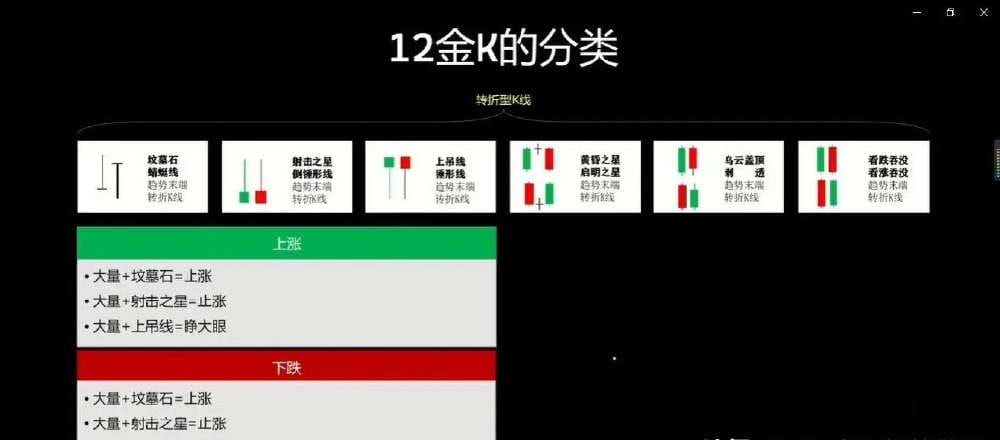
2. The combination of trading volume and 12 Golden K.
According to trend phases, they can be divided into warning K-lines, turning K-lines, and attacking K-lines. Since we trade mainly to find better entry or exit points, we focus only on turning K-lines and ignore other types of K-lines.
If during a rising trend, a grave stone (regardless of bullish or bearish) or a shooting star (regardless of bullish or bearish) appears with increased volume, it is very likely to cause a halt in growth and initiate a pullback. We could choose to go long with the trend or short against the trend to profit from the pullback.
But even so, it is still necessary to refer to other technical analysis methods, and we must never rely solely on volume-price analysis to make trading decisions.
Conversely, if during a downtrend, a dragonfly line (regardless of bullish or bearish) or hammer (regardless of bullish or bearish) appears with increased volume, it is very likely to stop falling and trigger a rebound, allowing us to choose to go short with the trend or long against the trend to profit from the rebound.
If a hanging man (regardless of bullish or bearish) appears with increased volume during a rising trend, although it cannot be said to be a halt in growth, we need to pay special attention because initial supply starts to emerge.
Similarly, if during a downtrend, a shooting star (regardless of bullish or bearish) appears with increased volume, although it cannot be said that it will immediately stop falling, we need to pay special attention because initial demand starts to emerge.
To facilitate understanding and memory, I have organized a chart that everyone can save.
In trading: the market can forgive you for making mistakes, but it will never forgive you for having no discipline. In this market, traders who can make consistent profits are exceedingly rare.
It is not because the market is too complex or the trend is too difficult to predict, but because the vast majority of people cannot even control their own hands.
The essence of trading is actually very simple:
Establish rules, enforce rules, maintain discipline, and persist for a long enough time — if you follow this, you are likely to make money.
But simplicity does not equal ease, especially in a market filled with volatility and temptation.
Many people fail because of 'emotion.'
Clearly planned stop-loss lines, but when the market rushes, one is reluctant to cut losses.
Clearly, position control has been established; after making a bit of profit, one wants to add more to 'eat a bit more';
Clearly set profit targets, but when the price arrives, one feels anxious, 'I’ll wait a little longer'—resulting in profits turning into floating losses, and floating losses into stop losses.
Ironically, some people rely on luck to hit a trade and immediately begin to swell with pride.
They forget discipline, forget risk control, and think of themselves as the chosen ones of the market.
But the market never indulges anyone — a single pullback can bring an account to zero, causing a collapse of mindset.
What’s worse is that they do not dare to admit that they have messed up and always seek comfort in things like 'the market is bad' or 'the main force has a conspiracy.'
True traders deeply understand one fact:
The market is never short of opportunities; what is lacking are those who can stabilize their minds and control their hands.
Trading is not about who is smarter, but about who is more disciplined.
Only those who can restrain themselves in the face of temptation and calm their hearts in the face of losses are worthy of surviving in this market.
Because trends will change, systems will alter, and strategies will shift, but a person's ability to control emotions and enforce discipline is the trump card for navigating through cycles.
Therefore, before winning the market, you must first win yourself.
This is the biggest dividing line between professional traders and amateur players.