Bitmine’s Tom Lee predicts Ethereum will drop to $4,075 before rebounding to $5,100 as ETFs face $196.6M in outflows during a technical correction.

Bitmine Chairman Tom Lee revealed exclusive insights into the price direction of Ethereum, predicting that the price of Ethereum will temporarily fall to the $4,075 to $4,150 range before rebounding to a new high near $5,100.
Through an August 19 post on X, Lee shared a confidential screenshot containing a letter from Mark Newton, global head of technical strategy at Fundstrat Global.
The email included Elliott Wave technical analysis, which indicated that Ethereum would see a constructive correction this week, followed by a potential breakout above $5,000.
The news comes as Ethereum holders face uncertainty over whether ETH has peaked and could fall below $4,000, or if the current movement represents a healthy pullback before another surge.
Institutional accumulation continues despite profit-taking
This uncertainty is reflected in recent selling pressure from whales, ETFs, and retail investors, which has pushed Ethereum’s price down from a local peak of $4,793 to a low of $4,198 before recovering slightly to $4,278 at the time of writing.
As Ethereum-focused exchange-traded funds shifted from positive to negative territory, selling pressure intensified, with outflows totaling $196.6 million, according to SoSoValue data.
Despite recent price weakness, current market statistics show that Ethereum exchange-traded funds still control approximately 6.5 million ETH in assets under management, or approximately $27.5 billion at current prices.
Corporate digital asset treasuries (DATs), including firms like Bitmine and Sharplink Gaming, are similarly building their Ethereum positions.
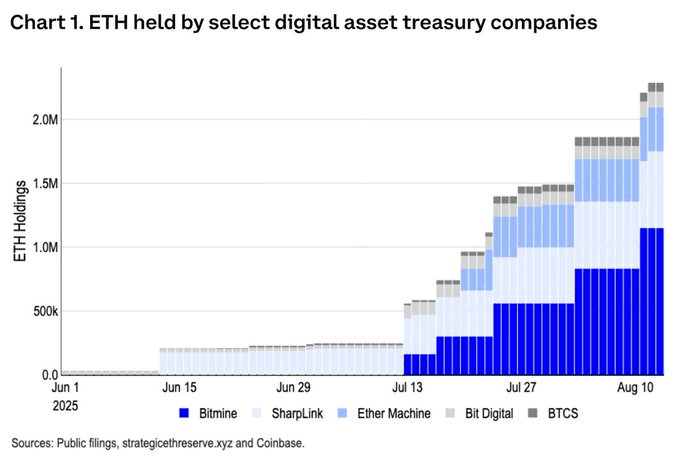
Together, these entities hold 2.2% of the total ETH supply, valued at over $10.2 billion.
Bitmine's Tom Lee is bullish on Ethereum rebounding to $5,100
Bitmine’s Tom Lee, who accurately predicted Ethereum’s $3,000 level when it was trading below $4,000, is now convinced that Ethereum’s rally is far from complete.
In a recent interview with Bankless, Lee highlighted the ETH/BTC ratio of 0.05, which marked the peak of the previous cycle in 2021, currently around $6,000 at today’s Bitcoin valuation.
He emphasized that Ethereum holds significant growth potential as more corporate treasuries enter the market and adoption increases.
In his assessment, it’s not unreasonable to think of “$7,000 — or even $12,000 to $15,000 by the end of the year” as a possible goal.
Lee also mentioned the ongoing Ethereum supply shock, noting that ETH holdings on centralized exchanges have reached a nine-year low.
Historically, when ETH balances reached similar lows, prices surged from $30 to $1,500.
He expects ETH to surge, comparing it to the boom times on Wall Street after the dollar went off the gold standard in 1971.
Fundstrat’s CIO believes Ethereum’s ability to capitalize on the White House’s GENIUS stablecoin bill and the SEC’s cryptocurrency initiative has the potential to become one of the most important macro trades of the next 10-15 years.
Technical analyst and Bitward Invest co-founder Dariusz Kowalczyk agreed with Lee’s sentiments but stressed that this week will be crucial for ETH’s price trajectory and the broader cryptocurrency market.
In his short-term analysis, he noted that if Ethereum can recapture the $4,550 to $4,571 area, then a new all-time high could be imminent. Currently, support is identified at $4,240 to $4,190.
However, the broader context includes key events expected this week that could impact both cryptocurrencies and macro markets.
The news began with a meeting between Trump and Zelensky in Washington on Monday, followed by the release of Federal Open Market Committee minutes on Tuesday, U.S. initial jobless claims data on Thursday and an expected speech by Federal Reserve Chairman Jerome Powell on Friday.
These developments are expected to generate significant market volatility.
Technical chart analysis supports ETH rebound to $5,100
From a technical perspective, the ETHUSD 30-minute chart shows a complete corrective structure within a descending wedge pattern, where the price action formed a W-X-Y corrective sequence, with the final move ending around 4,120-4,130.
The rejection from this area and the subsequent upward movement suggest that the correction is over and a new impulse wave is forming.
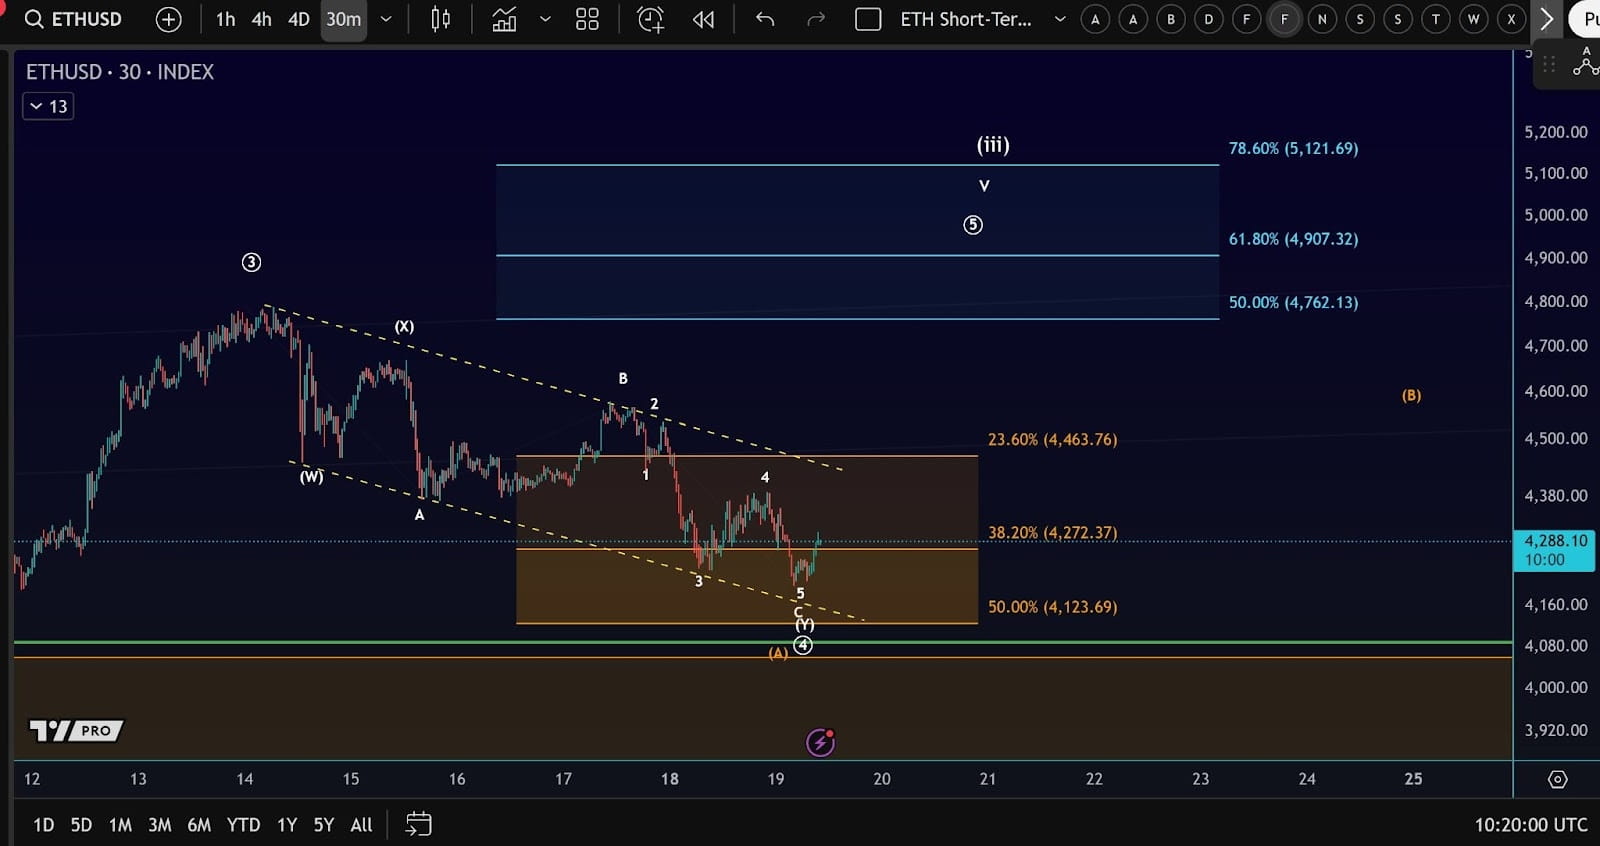
Fibonacci Extension levels between 4,760 and 5,120 indicate the possible target of the next bullish phase, with wave (iii) expected to move higher from current levels.
In the short term, if the price sustains support above the 4,120-4,160 zone, momentum favors continued upward movement with initial resistance around 4,460 followed by 4,760.
If the price breaks through these levels, a move towards 4,900 and 5,120 becomes increasingly likely, confirming the strength of the broader bullish trend.

