Having been in the crypto world for ten years and trading professionally for six years, over 3100 days, I have done long, short, ultra-short, and various types of methods, so I have a say in this matter.
I have always said that mastering a skill is the ten-thousand-hour rule. Eight hours a day, over 200 days a year, roughly five years, this is just the beginning.
The foundation of stable profit. There will inevitably be big pitfalls within ten years, so to be safe, do not put your capital beyond your capability within ten years.
Many experts who have traded from tens of thousands to hundreds of millions often just opened highly leveraged contracts, and many have also perished in a bear market, but you wouldn't know that. Human nature often leads to a loss of correct judgment in the face of major trends.
Back to the main topic, I will now share all my practical tips with you!
In Bitcoin BTC trading, the oscillators RSI, stochastic, CCI, ADX, AO, momentum, and MACD.
In the Bitcoin trading field, technical analysis can play an important role, and oscillators are key tools. Oscillators have developed over decades, helping traders make informed decisions by analyzing price momentum and market conditions. This article explores the history and usage of key oscillators utilized in Bitcoin trading.
Oscillators and their importance
Since the early 20th century, oscillators have been an indispensable part of technical analysis, initially used in the stock market. As traders sought tools to predict market trends, oscillators became popular in the 1970s. These mathematical structures measure the momentum of asset prices, providing insights into potential overbought or oversold situations. In the turbulent world of Bitcoin trading, oscillators offer traders an effective method to cope with price fluctuations.
Relative Strength Index (RSI)
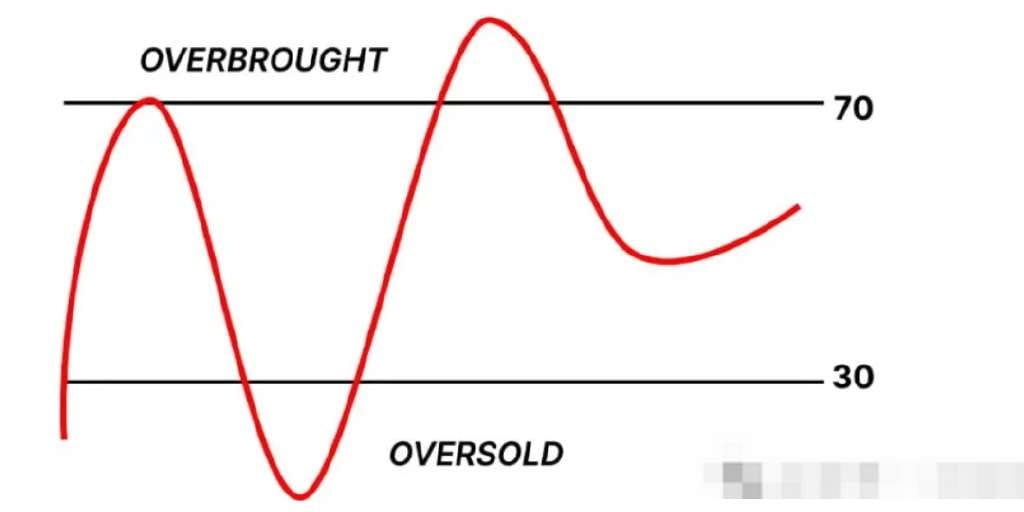
The Relative Strength Index (RSI) was developed by J. Welles Wilder Jr. in 1978 and is a momentum oscillator used to measure the speed and change of price movements. RSI values range from 0 to 100, where values above 70 indicate overbought conditions and below 30 indicate oversold conditions. For BTC traders, RSI is an important tool for identifying potential reversal points in Bitcoin, assisting in making strategic entry and exit decisions.
Random
The stochastic oscillator was developed by George Lane in the late 1950s, comparing specific closing prices of an asset with the price range over a specific period. The principle is that in a rising market, prices tend to close near the high points, while in a falling market, prices tend to close near the low points. BTC traders use the stochastic oscillator by analyzing the %K and %D lines to identify momentum and potential turning points.
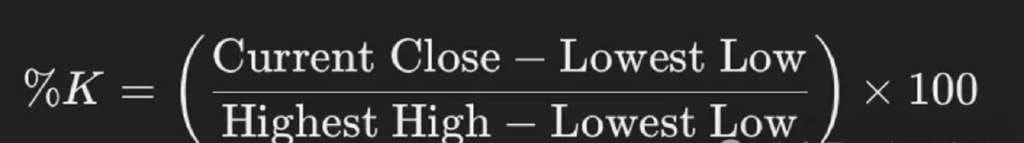
The stochastic oscillator is visualized through a chart containing two main lines: the %K line and the %D line. The %K line is calculated by comparing Bitcoin's closing price with the price range over a specified period, producing a responsive line that closely follows price movements. The %D line is smoother and slower, being the 3-period moving average of the %K line, providing a signal line that crosses above and below the %K line at key points. The y-axis of the chart ranges from 0 to 100, with horizontal lines marked at 20 and 80 to indicate oversold and overbought levels.
Commodity Channel Index (CCI)
The Commodity Channel Index (CCI) was created by Donald Lambert in 1980 to measure the difference between asset prices and their statistical averages. Although initially developed for commodities, it has been widely applied to various markets, including Bitcoin trading. Traders use CCI to identify cyclical trends in Bitcoin prices, helping to predict potential price reversals and capitalize on trading opportunities in Bitcoin.
Average Directional Index (ADX)
Welles Wilder Jr. also introduced the Average Directional Index (ADX) in 1978 to measure the strength of a trend rather than its direction. The ADX value ranges from 0 to 100, with higher values indicating a stronger trend. In cryptocurrency trading, ADX helps traders assess the strength of the current trend, enabling them to make more informed entry or exit decisions based on trend strength rather than direction.
Awesome Oscillator (AO)
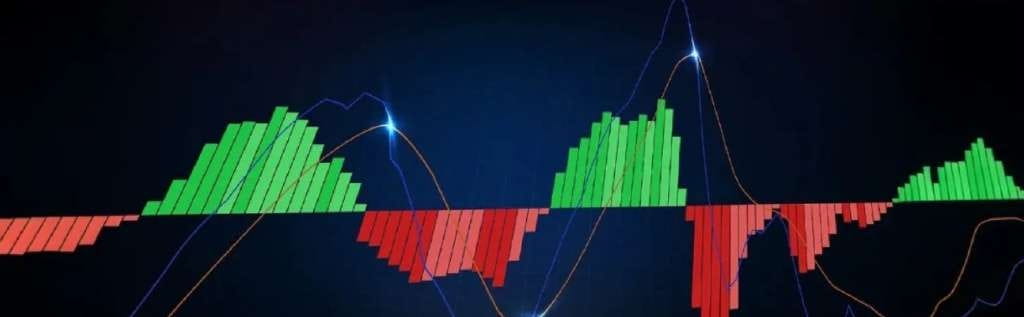
Developed by Bill Williams, the Awesome Oscillator (AO) measures market momentum by comparing the 34-period and 5-period simple moving averages. AO can help BTC traders identify potential trend changes and shifts in market momentum. By analyzing the histogram bars, traders can gain insights into potential market strength and make more informed trading decisions.
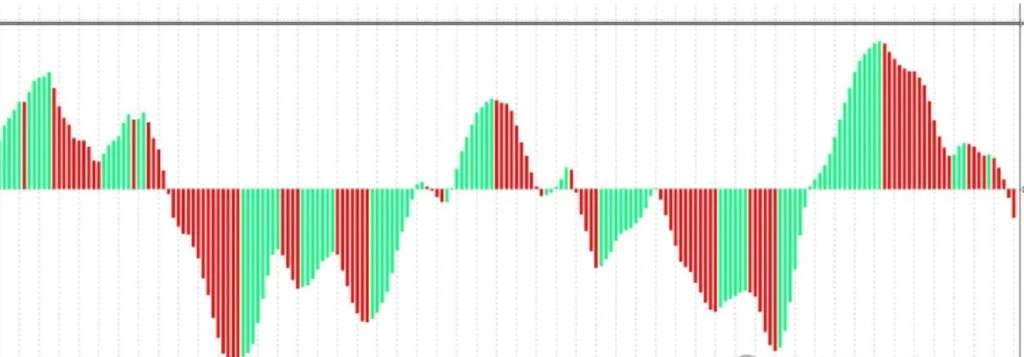
In technical analysis, AO is graphically represented as a histogram oscillating around the zero line, measuring market momentum by calculating the difference between the 34-period and 5-period simple moving averages (SMA) using (highest + lowest) / 2. The histogram bars are colored green or red, representing rising or falling momentum; a green bar appears when the current bar is higher than the previous one, indicating increasing momentum, while a red bar appears when the current bar is lower, indicating decreasing momentum.
Momentum Oscillator (MO)
Momentum oscillator (MO) measures the rate of change in asset prices over a specific period. For BTC traders, this is a simple yet powerful tool to gauge the speed of price changes. By comparing the current price with previous prices, traders can identify bullish or bearish momentum, helping to predict potential continuations or reversals in Bitcoin prices.
Moving Average Convergence Divergence (MACD)
Moving Average Convergence Divergence (MACD) was created by Gerald Appel in the late 1970s and is a trend-following momentum indicator. MACD consists of the MACD line, the signal line, and the histogram, which help traders identify potential buy and sell signals. For BTC traders, MACD is very useful for understanding market momentum and trend direction, assisting in timely trading decisions.
In technical analysis, MACD is represented by a dual-line chart, helping to identify changes in the momentum, direction, and strength of Bitcoin price trends. MACD is calculated by subtracting the 26-period Exponential Moving Average (EMA) from the 12-period EMA, resulting in the so-called MACD line. A signal line, which is the 9-period EMA of the MACD line itself, is then plotted to trigger potential buy or sell signals through crossovers. Additionally, the histogram represents the difference between the MACD line and the signal line, visually indicating changes when momentum widens or narrows.
Although oscillators like RSI, stochastic, CCI, ADX, AO, momentum, and MACD provide important insights for Bitcoin trading, they are not foolproof. These tools can help traders cope with BTC's volatility by providing valuable information about market conditions and potential price trends.
Traders should combine oscillators with other analytical methods and maintain a cautious attitude, acknowledging that in the dynamic world of Bitcoin trading, no tool can guarantee perfect predictions.
Success is not based on luck; choice is greater than effort, and the circle determines fate.
"How to roll positions with 1000U? Don’t guess blindly, follow these steps!"
Many people ask in the square every day: "Brother, how do I roll positions?" "Is there a specific step?"
Today, I will say it again:
Rolling positions, not heavy bets on life or daily critical hits.
But it is achieved step by step through "rhythm + position control + execution."
Taking 1000U as an example, follow these steps:
Step one: position control, starting position: within 500U (below 50%) or even for the first few trades, only use 200~300U to explore the road.
Why?
The most crucial task for small accounts in the early stage is:
"Survive, don't blow up, and don't let drawdowns exceed 20%." If you can't even protect your account, how can you talk about flipping it?
Step two: only follow rhythms you understand.
What does it mean to understand?
✅ There is a clear support/resistance zone.
✅ There is a combination with large trend directions.
✅ There are controllable stop-loss levels and opportunities with a risk-reward ratio of over 2:1.
In simple terms, the initial goal is:
"Make one trade, live one trade."
Step three: write down stop-losses in advance, set them up, and never cancel them on the spot.
Limit maximum loss per trade to within 5%-7% of the account.
For example, with a 1000U account, the maximum single trade loss should not exceed 50-70U.
Some say this is too conservative? Then ask yourself: do you want to take a gamble?
Still want to keep the account alive to reach 5000U or 10,000U?
Step four: don’t be greedy with profits; take what you can.
For example:
✅ Small fluctuation target: 30-50 points.
✅ Major rhythm target: 80-150 points
✅ Medium-term large order: maintain a risk-reward ratio of over 3:1.
Step five: once you reach 3000U, start rolling larger positions, and after doubling the account,
Start increasing positions, for example:
✅ Increase single position to 800U~1000U.
✅ Control maximum risk per trade to within 3%-5% of the account.
✅ No stage drawdown should exceed 15% of the account.
What does it mean? In the small money stage, protect your life; in the medium money stage, accelerate position increase.
In the large capital stage, protect profits and control drawdowns.
Step six: each time you double your account, withdraw some profit (lock in profits).
For instance, rolling from 1000U to 3000U.
First, withdraw 500U.
Account drawdowns can also be psychologically stable. Surviving is the qualification to flip the account.

Having floated in the crypto world for a long time, I am often asked: how to make money?
My answer is eight words: do not earn small money, do not lose big money. The words are simple, but to practice them requires sufficient resilience.
Let me give an example:
You enter with 20,000, and after opening a position, the price rises to 21,000. Overjoyed, you decisively take profits, securing a 5% gain, feeling great.
Unexpectedly, the market surged all the way to 25,000... You made 5%, but missed 50% of the huge wave!
Feeling the pain, you tell yourself: this time I must make big money! So, when the price falls back to 20,000, you decisively enter the market. The price rises to 21,000 again; you suppress the urge to take profits, silently remembering the lesson, and hold on! However, the situation changes suddenly; the price not only drops back to the starting point but also dips to 19,500.
Unfortunately, you can only stop loss and leave the market.
How many retail investors struggle throughout their lives, earning small profits while missing out on big trends and being trapped by not taking profits? They never find liberation.
So, is there a holy grail that works for all? Frankly speaking: no.
This is a multiple-choice question. For me, I choose not to earn small money and patiently remain hidden.
Trading is essentially a journey of practice over time. Whether it's short-term battling or long-term layout, the essence lies in: seizing a wave of 200% massive trends and striving to hold on to most of the fruits. When the next opportunity arises, achieving another 200% means four times!
As long as profits can be sustained, the snowball of compound interest will become unstoppable. Conversely, even if one once had boundless glory, if the final profits are all given back, what is the meaning?
Perhaps some people glimpse the door and feel that wealth is imminent. However, finding the path only means that the probability of profit has increased. Truly practicing this principle of not earning small money tests one's temperament, determination, and courage, which is quite harsh.
Can you endure long waits just for that perfect point of the golden strike?
The anxiety of missing out, the impulse to take profits when in floating gains, and the fear of losses when holding a position...
All must be repeatedly tempered in the furnace of time. If you are determined to step into this path, you must be extremely cautious and dare to practice and try mistakes with your profits.
Indeed, being able to find the path is far better than blindly crashing into it. After all, far too many people go through life without ever seeing the road clearly.
I have come this far, experiencing pain, confusion, and self-doubt, almost thinking I wasn't cut out for this. Until I finally had an epiphany, simplifying all those flashy trading techniques and focusing on the essence of a few key tactics, this is when I truly stepped onto stable ground.
Now, life is quite enjoyable, fishing, playing football, and meeting old friends for a drink, feeling great! Today, I will share with you the insights I have gained!
Remember this: before enlightenment, trading cryptocurrencies is harder than climbing to the sky; after enlightenment, making money becomes much easier!
Want to succeed in the crypto world? You need to understand these four things: philosophy, mathematics, psychology, and skilled gaming!
Look at the trend using philosophical thinking: don’t get too caught up in logic; otherwise, mathematicians would have become rich long ago.
Look at the project using logical thinking: don't just ponder human nature; otherwise, psychologists would have long been the richest.
Observe market sentiment and use human thinking: don’t just think about taking a gamble; otherwise, gamblers would have dominated the crypto world long ago.
Look at specific trades using gaming thinking: don’t just talk about philosophical principles; otherwise, why would philosophers even trade in cryptocurrencies?
In simple terms, if you want to mix in the crypto world, you need to think like a philosopher and mathematician, but most importantly, you have to be a skilled gamer!


