On Tuesday (August 19), as Asia opened a new round of trading, Bitcoin attempted to rebound above the $115,000 mark, while Ethereum traded above $4,200. Traders digested U.S. Treasury Secretary Scott Bessent's clarification—that strategic reserves will be filled through budget-neutral acquisitions rather than direct government purchases—while also waiting for Powell to speak at the Jackson Hole meeting, where he is expected to elaborate on the reasons for maintaining interest rates.
Bitcoin fluctuated between $114,993 and $117,620 yesterday, with trading volume significantly above average. According to Glassnode data, Bitcoin has fallen over 7% since reaching the historical high of over $124,000.
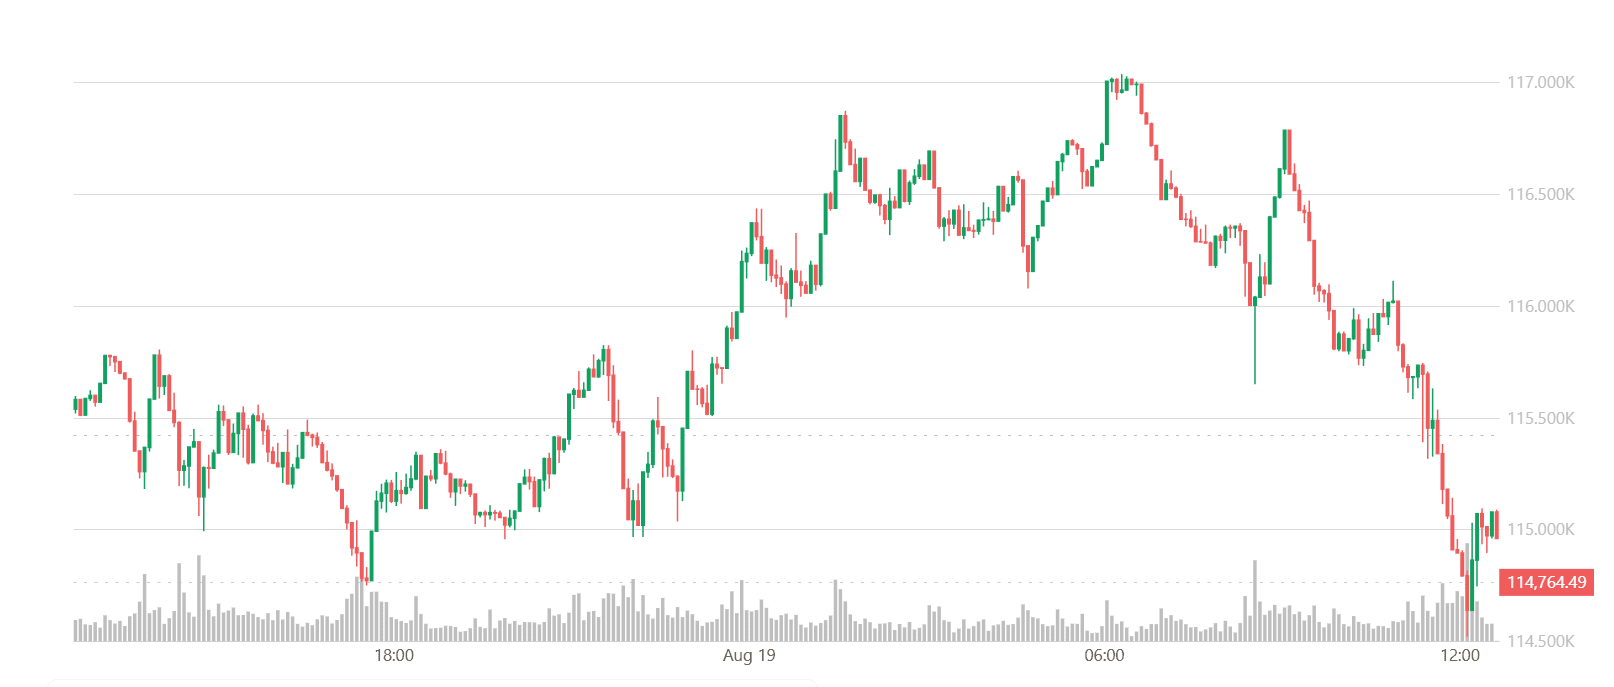
During the weekend, traders took profits totaling over $3.5 billion. On Saturday alone, profits realized amounted to $3.3 billion, the highest single-day level since mid-July and one of the largest since 2025.
Ethereum fell 3% on Monday to $4,330.61, with volatile trading and multiple obstacles close to historical highs. Despite attracting $3.71 billion in inflows for the U.S. spot ETF, retail investors continue to sell.
For most of this year, Bitcoin has been achieving profits almost every day, recording net losses on only about 10 trading days. This trend reflects Bitcoin's steady rise from $90,000 at the beginning of 2025.
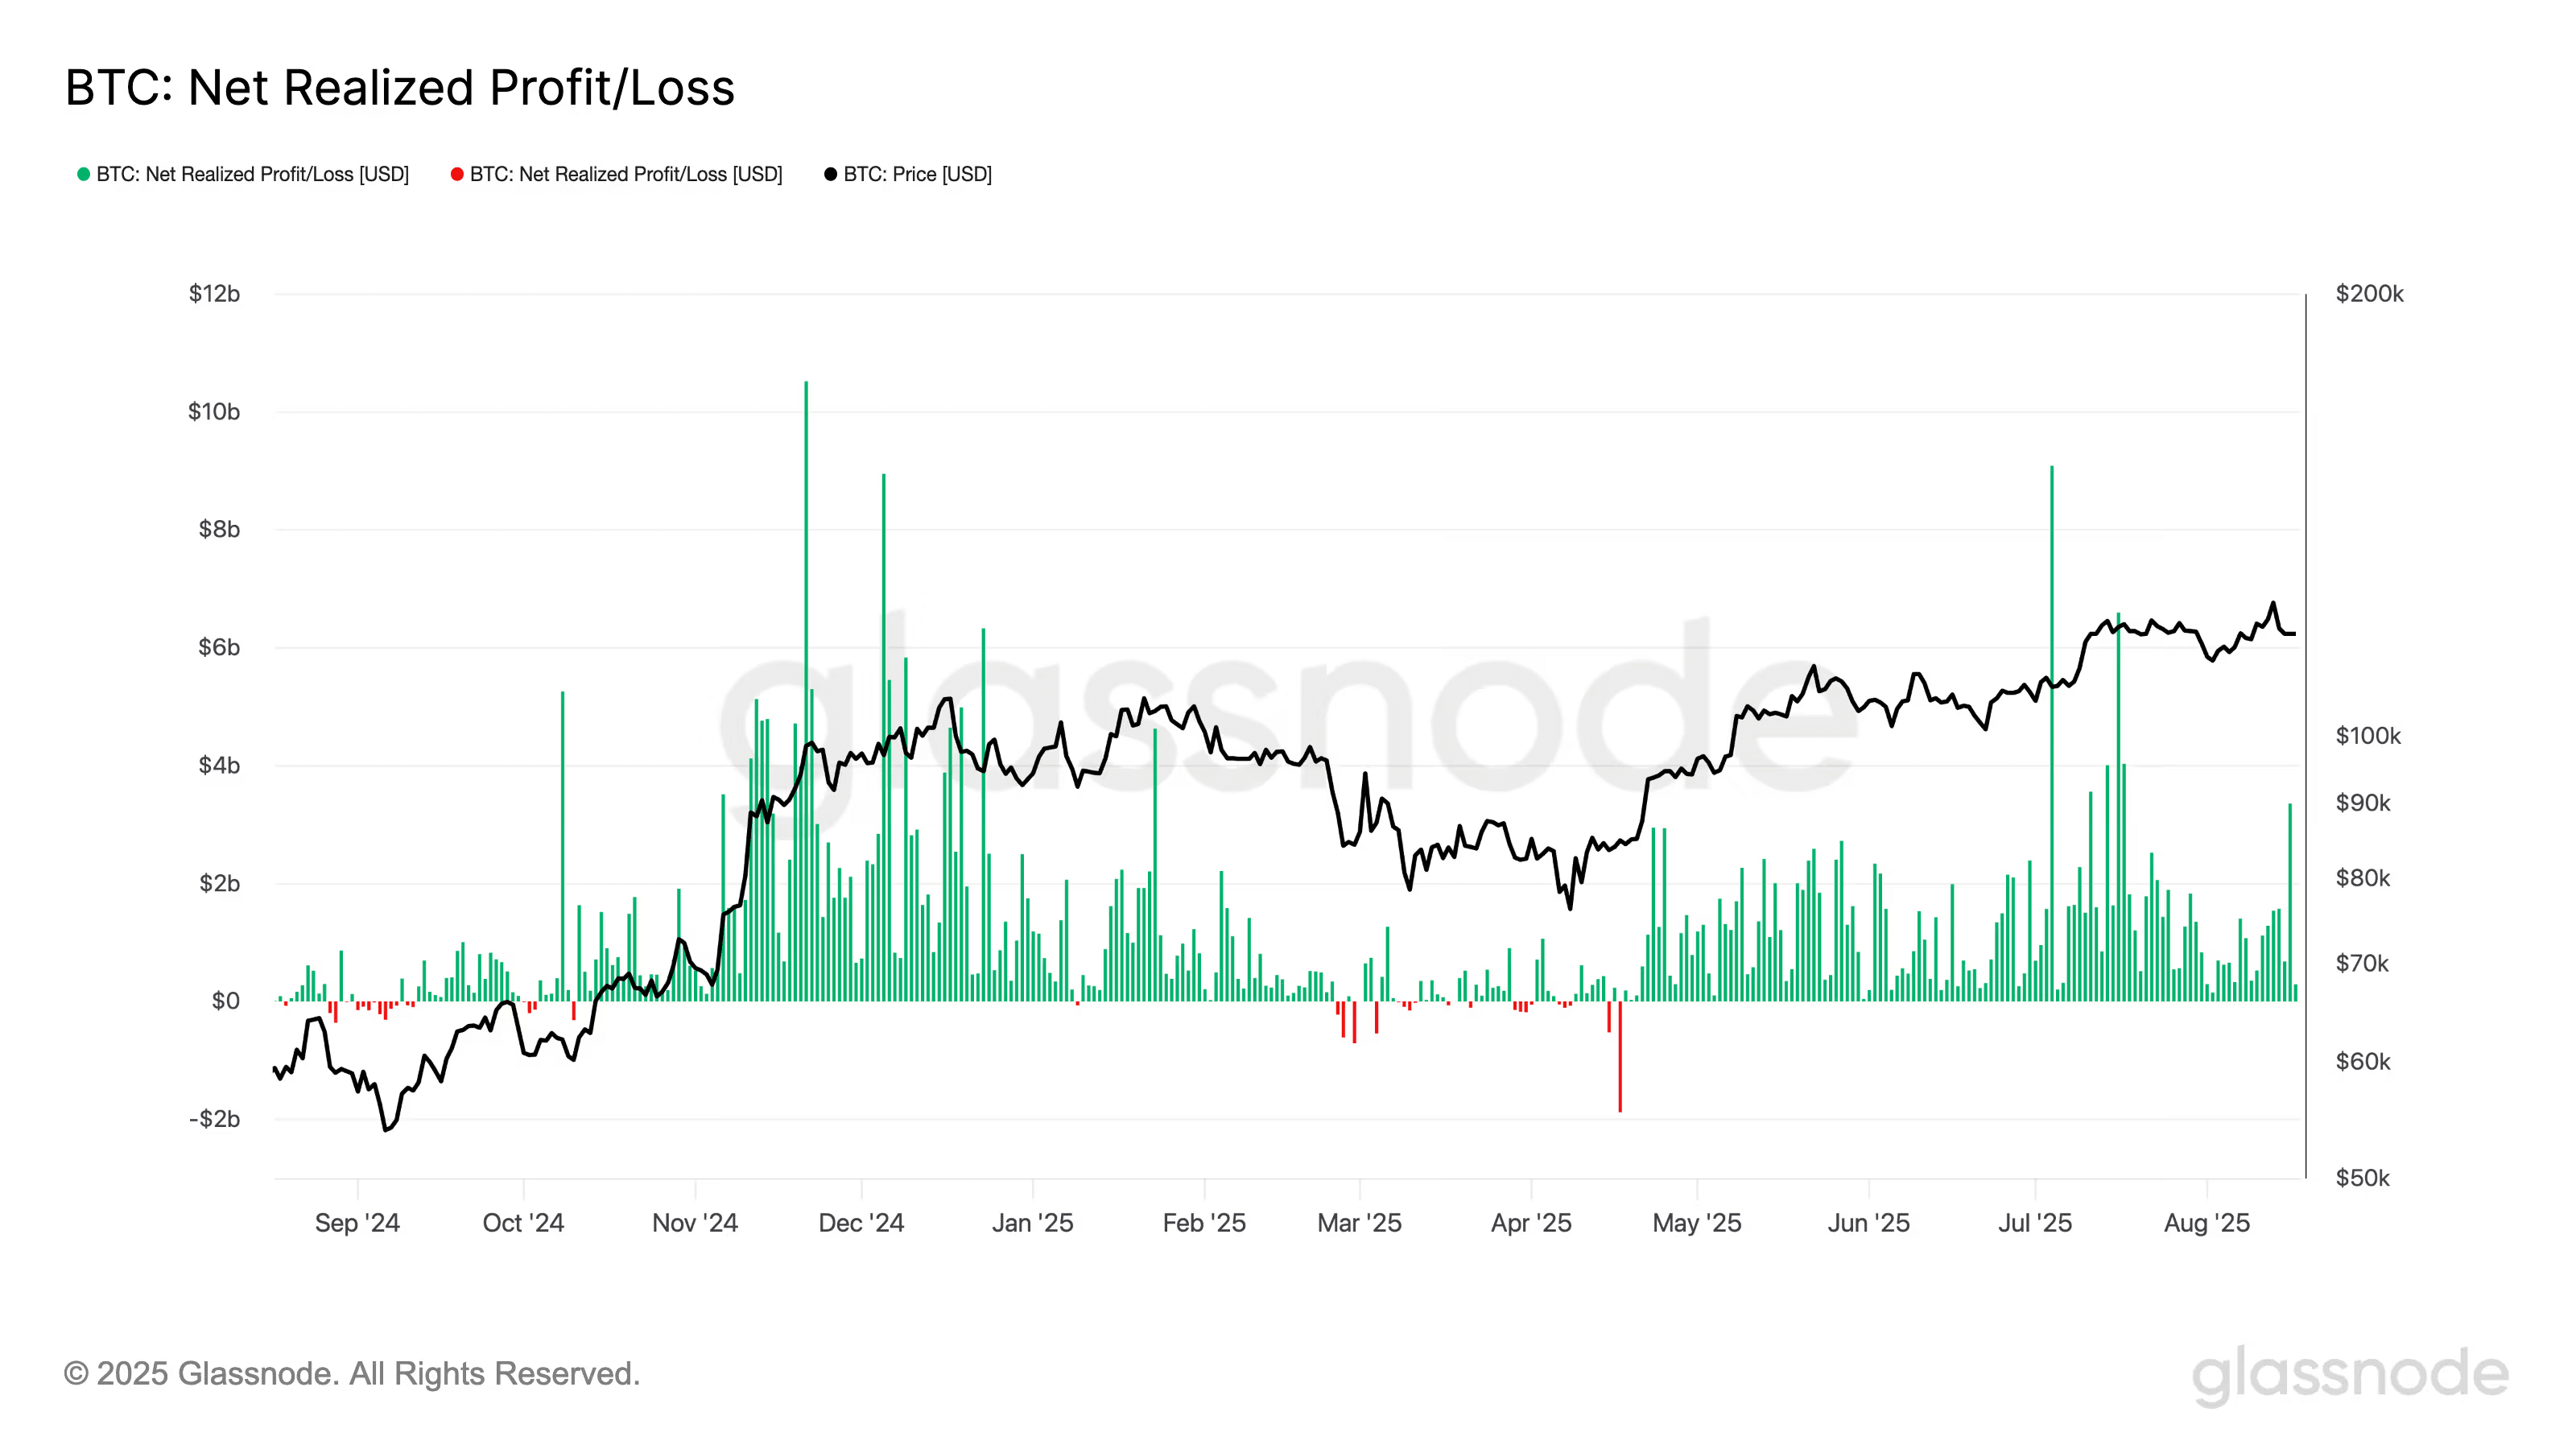
Since dropping to a low of $76,000 in April, the pace of profit-taking has accelerated, especially after breaking the $100,000 milestone, intensifying selling pressure. This drop closely followed Bitcoin's historical high of $124,000 earlier this month.
It is noteworthy that the magnitude of each pullback after reaching historical highs this year has been smaller than the last, indicating that the market is gradually maturing and its resilience is increasing: a 30% pullback in January, 12% in May, 9% in July, and currently only 8% in August.
The CoinDesk 20 Index (CD20), which tracks major crypto assets, fell 2.4%. Polymarket probabilities indicate that traders expect the market to weaken before the end of August. The most likely outcome for Bitcoin is to close below $111,000 (34% probability); for Ethereum, the most likely close is around $4,800 (43% probability).
The Singapore market maker Enflux indicates that the market is being pulled by dual forces: on one hand, there is strong institutional confidence (for example, Strategy Inc. purchased an additional 430 bitcoins and shifted structured financing); on the other hand, there is a lack of immediate follow-up from retail investors.
Enflux notes that VanEck reaffirmed its year-end Bitcoin target of $180,000, indicating that institutions are still preparing for a rise; however, the coins favored by retail investors (such as XRP and DOGE) are constrained by the SEC's delay in approving ETFs. Solana is an exception, with Enflux citing its 'hidden strength' in USDC transfers and new token issuance from PumpFun.
Overall, the market still has support at the top structure, but is maintaining a defensive posture at the tactical level, waiting for the Jackson Hole symposium on Thursday, where Federal Reserve Chairman Powell is expected to explain the reasons for maintaining interest rates amid higher-than-expected inflation and ongoing challenges to the Fed's independence from the White House.
Despite this, the crypto search interest has risen to a four-year high, and the (GENIUS Act) is quickly advancing in Washington, awaiting regulatory handling, setting the stage for a broader rally.
But at present, predictive markets and price trends indicate that confidence is concentrated on the institutional side, while capital flows remain selective.
Bitcoin may face profit-taking.
Bitcoin may maintain a sideways consolidation in the short term, as a valuation indicator is flashing red, indicating that Bitcoin holders are more likely to choose profit-taking.
According to a report released by the sentiment analysis platform Santiment on Monday, the Market Value to Realized Value Ratio (MVRV) for Bitcoin (BTC) is currently at 21%. This metric is used to measure whether an asset is overvalued. This level indicates that the average investor who bought Bitcoin in the past year still has a considerable unrealized profit.
Santiment noted: 'Although not at historically extreme high levels, this is seen as a mild danger zone as it increases the risk of profit-taking.'
The historical high of $124,128 for Bitcoin last Wednesday saw a 10% increase in the nine days prior, but Bitfinex analysts noted in the day's market report that due to the lack of macroeconomic catalysts to support prices, 'this surge quickly fizzled out.'
Typically, when Bitcoin enters a consolidation or decline phase after reaching new highs, investors are more inclined to take profits, fearing that prices have reached a local peak.
Bitfinex analysts added that Bitcoin may experience sideways trading in the short term: 'The market has firmly entered a consolidation phase, taking a wait-and-see approach as investors assess the upcoming macroeconomic catalysts.'
One key macro catalyst is the Federal Reserve's decision to cut interest rates on September 17. According to the CME FedWatch Tool, 83.6% of market participants expect this highly anticipated rate cut to be enacted.
Meanwhile, many Bitcoin traders are not optimistic about a short-term rise. CoinGlass data shows that approximately $2.2 billion in short positions have accumulated in the market, and these shorts will face the risk of being forcibly closed if Bitcoin returns to the historical high of $124,128.
However, Santiment pointed out that Bitcoin whales remain confident in higher prices: 'The largest holders of Bitcoin have not sold during this surge. Wallets holding 10 to 10,000 BTC have been actively accumulating after reaching historical highs.'
Bitcoin Technical Analysis
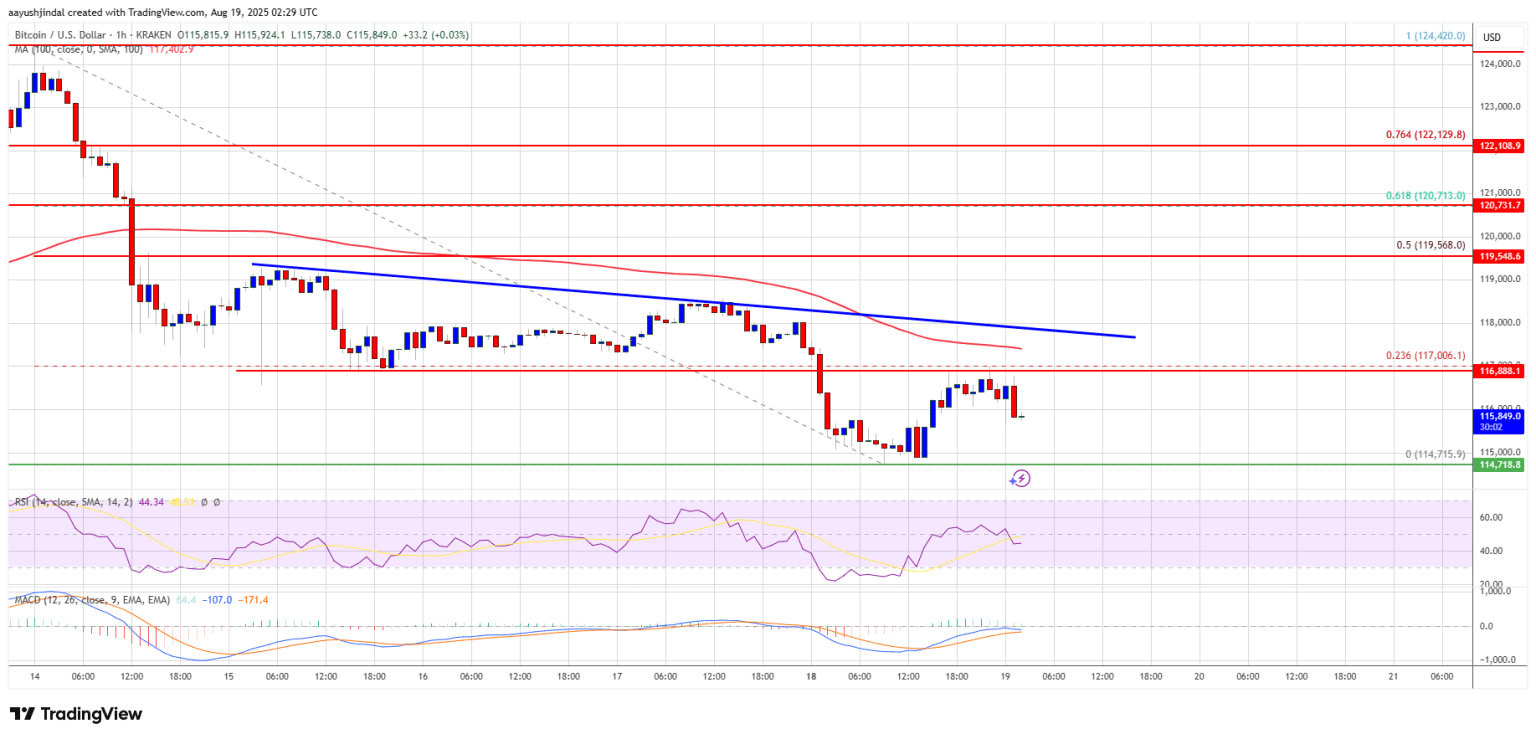
The price of Bitcoin began a new round of declines after breaking below the $120,000 level. BTC accelerated its decline and fell below the $118,500 support zone. It then broke below the $116,500 support and the 100-hour simple moving average, testing the $114,750 area, hitting a low of $114,715. The current price has rebounded from the low of $114,715 but still hovers below the 23.6% Fibonacci retracement level from the high of $124,420 to the low of $114,715.
Currently, Bitcoin is trading below $117,000 and the 100-hour simple moving average. The direct resistance is around $117,000. The first key resistance is near $118,000, while a key descending trend line on the BTC/USD hourly chart has formed resistance at $118,000. The next resistance is at $118,500, and if it can close above this level, the price may rise further. In this case, Bitcoin could rise toward the $119,500 resistance (near the 50% Fibonacci retracement level of the drop from $124,420 to $114,715). Further upward movement might push the price toward $120,000, with a major target at $121,500.
If Bitcoin fails to break through the $118,000 resistance area, it may initiate a new round of declines. Direct support is at $115,000, with the first major support at $114,750. The next support is in the $113,500 area. If it continues to decline, the price could fall toward the $112,000 support level. Major support is at $110,000; if it breaks below this level, BTC may continue to drop.
Technical indicators:
Hourly MACD: accelerating in the bearish zone.
Hourly RSI (Relative Strength Index): currently below the 50 level.
Key support levels: $115,000, followed by $113,500.
Key resistance levels: $118,000, followed by $118,500.


