⚠️ $ETH
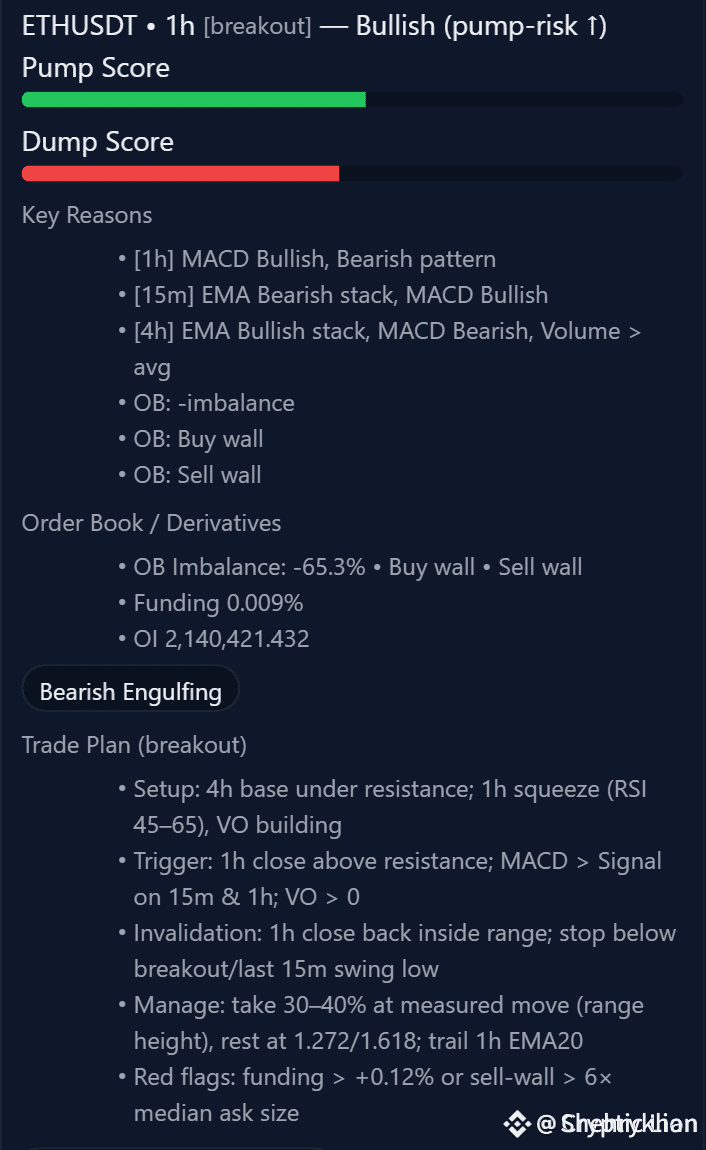
Ethereum $ETH on the 1-hour chart is flashing multiple bearish signals that could mark the beginning of a correction phase. While the overall verdict still points to a bullish “pump-risk ↑,” the actual structure and order flow tell a different story — caution is advised.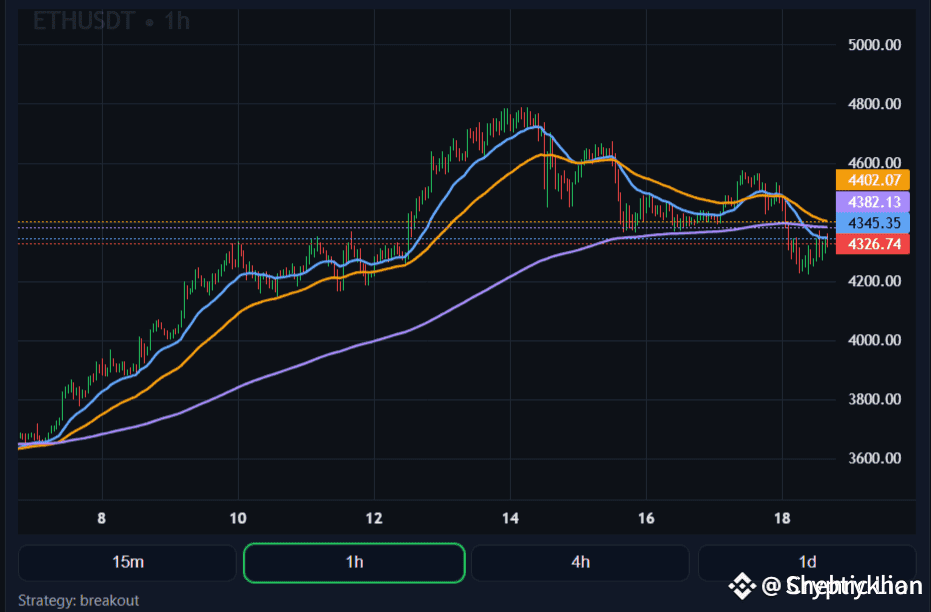
---
🔎 Trend & Momentum Breakdown
EMA Structure: Normally, EMA20 > EMA50 > EMA200 alignment confirms strong bullish momentum. However, price has now slipped below EMA20 and EMA50, showing weakness. It’s currently hovering near EMA200 — the last defense for bulls. A clean breakdown below this level could accelerate further downside.
MACD Indicator: The MACD line is trending below the signal line, confirming that selling momentum is building. Sellers are in control in the short term.
Volume Oscillator: Sitting at –0.006, the indicator highlights weak buying activity. Flow is tilted toward sellers, which supports the MACD’s bearish signal.
RSI Levels: At 45.6, RSI is neutral. This means the market isn’t oversold yet, leaving room for additional downside.
---
📊 Order Flow & Derivatives Signals
Order Book Imbalance: –65.3% imbalance shows that sell-side liquidity dominates, with sellers outweighing buyers.
Funding Rate: At 0.009%, the market is neutral — no aggressive long or short positioning is happening yet.
Sell Walls: Overhead liquidity zones indicate strong resistance for rallies. This creates a supply-heavy environment, making upside breakouts difficult.
---
📝 Technical Outlook
Short-Term Bias: Bearish. Unless $ETH quickly reclaims $4,480–$4,500, the price is likely to retest the $4,200–$4,150 zone. If that level gives way, a drop toward $4,000–$3,950 becomes highly probable.
Invalidation for Bears: A 1-hour close above EMA50 ($4,480) with strong volume and a bullish MACD crossover would shift the bias back to bullish, opening the door for a retest of $4,600–$4,700.
---
⚠️ Final Takeaway
Ethereum is standing at a critical juncture. Losing short-term EMAs, weakening momentum, negative volume, and a 65% sell-side imbalance all give bears the upper hand. Traders must watch the $4,200 support zone closely — if it cracks, a fast move toward $4,000 is on the cards.
👉 For now, the market favors caution and defensive pos
itioning until bulls reclaim $4,500 convincingly.