Detailed analysis of the BNB/USDT chart
General context and evolution from previous images
The analysis of the BNB/USDT pair shows a dynamic evolution since early August. On August 6, with a price of around $772, BNB was in a moderate bullish rally. Technical indicators, such as positively aligned EMAs and a bullish MACD, along with a neutral RSI, suggested positive momentum. Breakout strategies were validated with the subsequent rise to a new all-time high (ATH).
On August 17, the situation intensified. At 12:04 p.m., the price had risen approximately 10% to $849.12, consolidating near the ATH of $865. Although the MACD was negative, the RSI remained above 50%, and the Bollinger Bands were expanding, indicating increasing volatility. In the afternoon, at 6:50 p.m., there was an intraday rebound to $856.97. The MACD turned positive and volume increased, reflecting market interest. However, at 8:33 p.m., there was a pullback to $849.35, a typical post-ATH correction, with a negative MACD and stable volume.
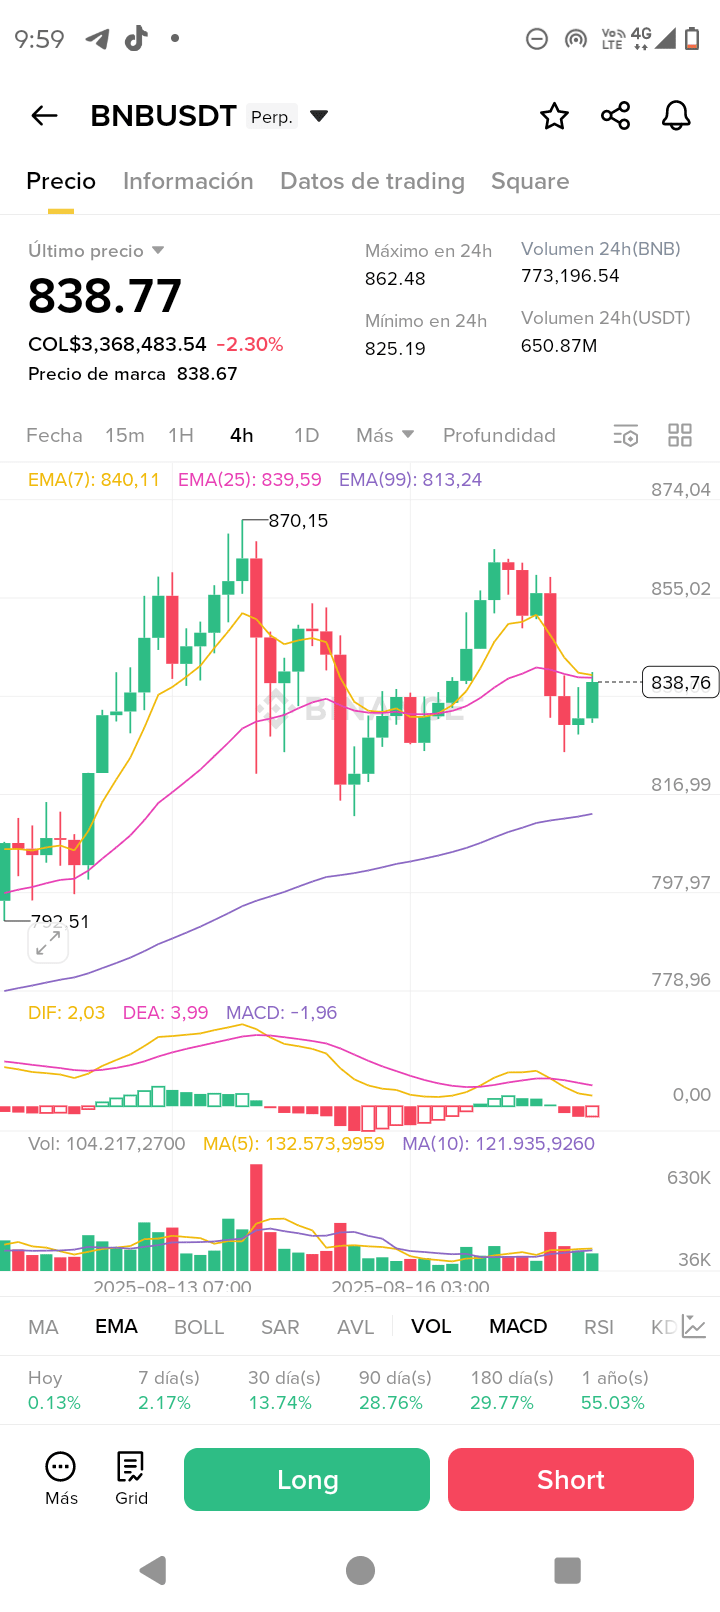
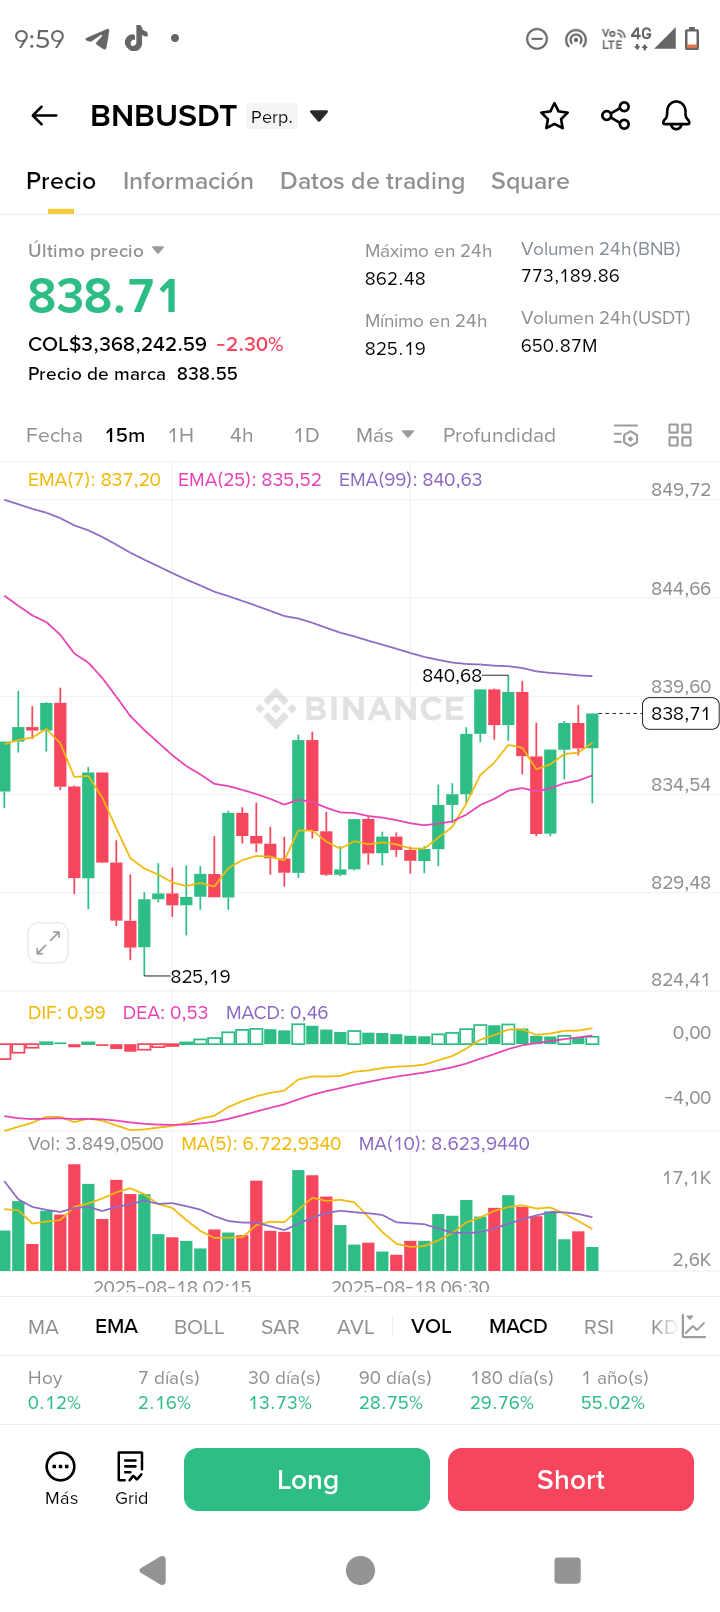
The current images, from August 18 at 9:59 a.m., show the continuation of this correction. The price stabilized around $838.77, which represents a decline of 2.30% in 24 hours. The daily price range, from $825.19 to $862.48, reflects significant volatility. The 24-hour volume, of approximately 773,000 BNB, is notably high, which could indicate panic selling or strong accumulation by buyers. In summary, BNB has had a rally of approximately 8-9% since August 6, but the current correction of 3-4% from its ATH seems to be a normal profit-taking. The medium-term trend remains bullish, driven by network improvements and increased adoption, although the risk of a deeper correction persists if a rebound does not occur.
Technical details of the current chart
Price and market data
* Current price: $838.77 / $838.71 USDT, with a variation of -2.30% in 24 hours.
* 24h High: $862.48, very close to the previous ATH.
* 24h Low: $825.19, a support level that has been tested.
* 24h Volume: 773,196.54 BNB, equivalent to about $650.87 million USDT. This high volume, greater than previous days, suggests significant interest from buyers and sellers.
* Others: The circulating volume is approximately $3,368 million, and the mark price is $838.67.
Technical indicators
* EMAs: The 7 and 25 period EMAs are above the current price, indicating a short-term bearish crossover. However, the 99-period EMA, at $813.24, shows that the long-term trend remains bullish.
* MACD: The MACD shows a bearish divergence in one image (-1.96) and a possible start of bullish reversal in the other (+0.46), reflecting market indecision and volatility.
* RSI (14): At 55.03%, the RSI is in a neutral range, with no signs of overselling, suggesting that the correction could continue if there is no buying momentum.
* Moving Averages (MA): The MA line on the chart is descending, indicating short-term bearish momentum.
* Volume: The high volume has manifested in dominant red bars during price drops, which could signal capitulation or a possible formation of a floor.
Price patterns and trend
* General trend: The long-term trend is bullish, but the current overnight correction, with dominant red candles, forms a bearish reversal pattern. This pattern could be a double top at $862, although a tentative rebound is observed in the second image.
* Supports and resistances:
* Key supports: The 24-hour low at $825.19 is the most immediate support. Below, the levels of $819-830 and the psychological support of $800 are found.
* Resistances: The first resistance is at the EMA levels, around $839-840, followed by the 24-hour high at $862.48. Bullish targets are set at $900-950.
* Observed patterns: The post-ATH correction is evident. The high volume activity suggests possible accumulation at the $825 support, which could indicate the formation of a bottom.
News analysis and recent sentiment
News from August 18, 2025, indicates a modest correction from the ATH of $864 to the range of $831-838. Despite this, there is perceived strong underlying demand. Market projections point to solid support between $819 and $825, with price targets that could reach $900-1000 in the coming weeks, driven by network improvements like Maxwell and increasing institutional adoption.
The sentiment on social media like X is mixed to bullish. Some recent posts highlight the stability of the price around $837, while others mention new listings and the bullish momentum of BNB's treasury. Overall, cryptocurrency holders are cautious, but there is optimism about the possible approval of an ETF and the growth of the network.
Best trading options
The analysis of price evolution, from the initial rally to the current correction, suggests that the best opportunities lie in the pullback strategy in an overall bullish trend.
| Strategy | Entry | Target(s) | Stop-Loss | Main Risk | Probability (current) |
|---|---|---|---|---|---|
| Pullback (Recommended) | Buy at $825 / $830 if there is a rebound with bullish volume. | $840 / $900+ | < $819 | If the price does not rebound and the decline is deeper. | High (70%) |
| Bullish Breakout | Buy if the price exceeds $840 / $862 with a positive MACD. | $900 / $950 | < $838 | False breakout, the price quickly retraces. | Medium (60%) |
| Bearish (Conservative) | Enter short if the price falls below $825. | $800 / $819 | > $840 | The long-term bullish trend could reverse the decline. | Low (30%) |
Conclusion and recommendation
BNB has experienced a controlled correction from its all-time high of $864, stabilizing at $838, with key supports at $819-825 and long-term price targets of $900-1000. This correction appears to be a healthy profit-taking in a context of strong demand and network improvements.
The best strategy at this moment is the pullback strategy, which consists of taking advantage of the current drop to enter a buy position in the $825-830 range, with an initial target of $840 and potential extension towards $900. A strict stop-loss at $819 is recommended to manage risk. It is crucial to monitor volume and network news, as well as to maintain low leverage due to high volatility.
due to high volatility.