1. Technical Analysis
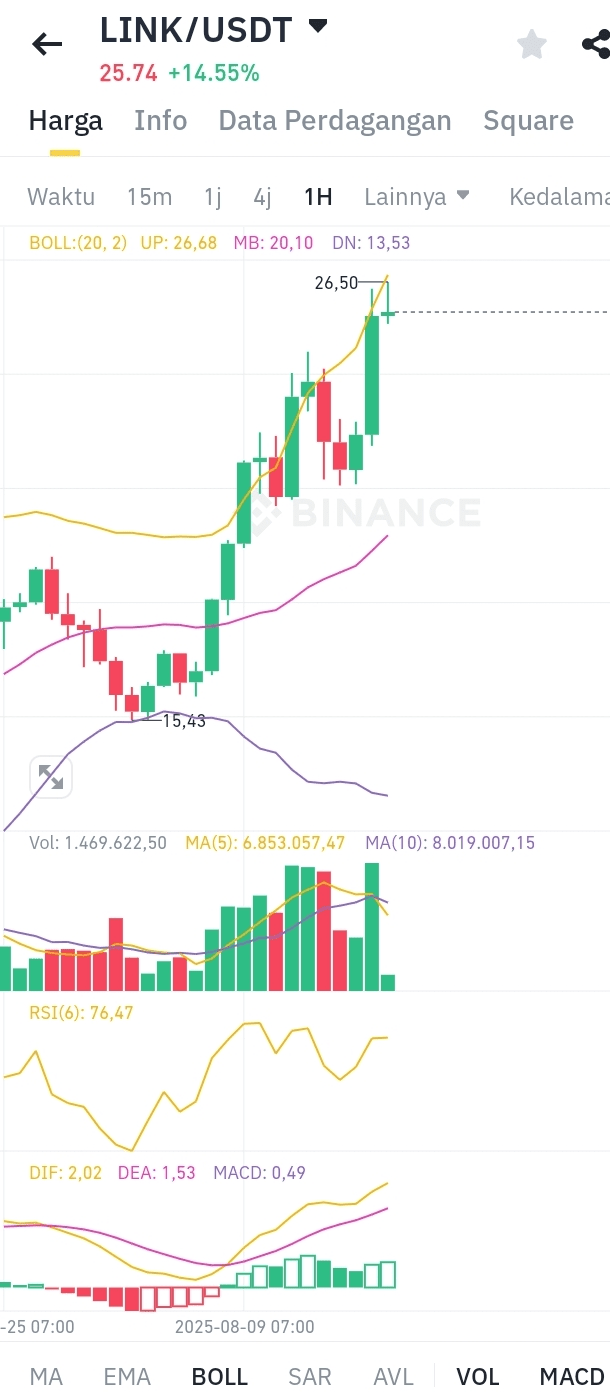
Current Price: 25.74 USDT (+14.55%) Significant increase indicates bullish momentum, but high RSI may signal overbought.
Bollinger Bands Indicator (20,2):
Upper Band (UP): 26.68
Middle Band (MB): 20.10
Lower Band (DN): 13.53 Interpretation: Price approaching upper band, potential resistance at 26.68. If breakout, it can continue to rise; if rejected, it may retrace to MB (20.10).
Trading Volume:
24h Volume: 1,469,622.50
MA(5) Volume: 6,853,057.47 (higher than actual volume, indicating a decrease in short-term buying interest). Implication: Price increases are less supported by high volume, caution is needed for corrections.
RSI(6): 76.47 (Overbought) Signal: Potential pullback or consolidation before continuing to rise. Monitor whether RSI remains above 70 or drops.
MACD:
DIF: 2.02 (above DEA)
DEA: 1.53
MACD Histogram: 0.49 (positive, bullish momentum). Confirmation: Bullish signal while DIF > DEA, but be cautious if the histogram shrinks.
2. Important Levels
Support:
24.17 (last low price)
20.10 (MB Bollinger Bands)
13.53 (lower band, far away, unlikely unless trend reversal).
Resistance:
26.68 (upper band)
28.00 (psychological)
30.00 (medium-term target if strong breakout).
3. Trading Strategy
A. Bullish Scenario (Breakout):
Trigger: Price closes above 26.68 with high volume.
Entry: Buy at 26.70-27.00.
Target Profit: 28.00 (take profit 1), 30.00 (take profit 2).
Stop Loss: Below 25.50 (minor support).
Risk Management: Allocate 2-3% of capital per trade.
B. Correction Scenario (Overbought):
Trigger: RSI falls below 70 + price rejected at 26.68.
Entry: Sell/short at 25.50 (break minor support).
Target: 24.17 (strong support), 20.10 (if strong bearish).
Stop Loss: Above 26.80.
C. Alternative Range Trading:
Buy Zone: 24.17-25.00 (test support).
Sell Zone: 26.50-26.68 (test resistance).
4. Additional Notes
External Factors: Monitor news related to Chainlink (upgrades, partnerships) or macro crypto market sentiment.
Leverage: Avoid high leverage if volatility is unclear.
Timeframe: Use 1H/4H for more accurate signal confirmation.
Disclaimer: This analysis is not financial advice. Evaluate risks and adjust to your risk profile.