$BNSOL To predict if BNSOL could reach the ceiling, we need to analyze the two charts you provided. The charts show the price of BNSOL on a 1-day timeframe (1d).
Chart Analysis
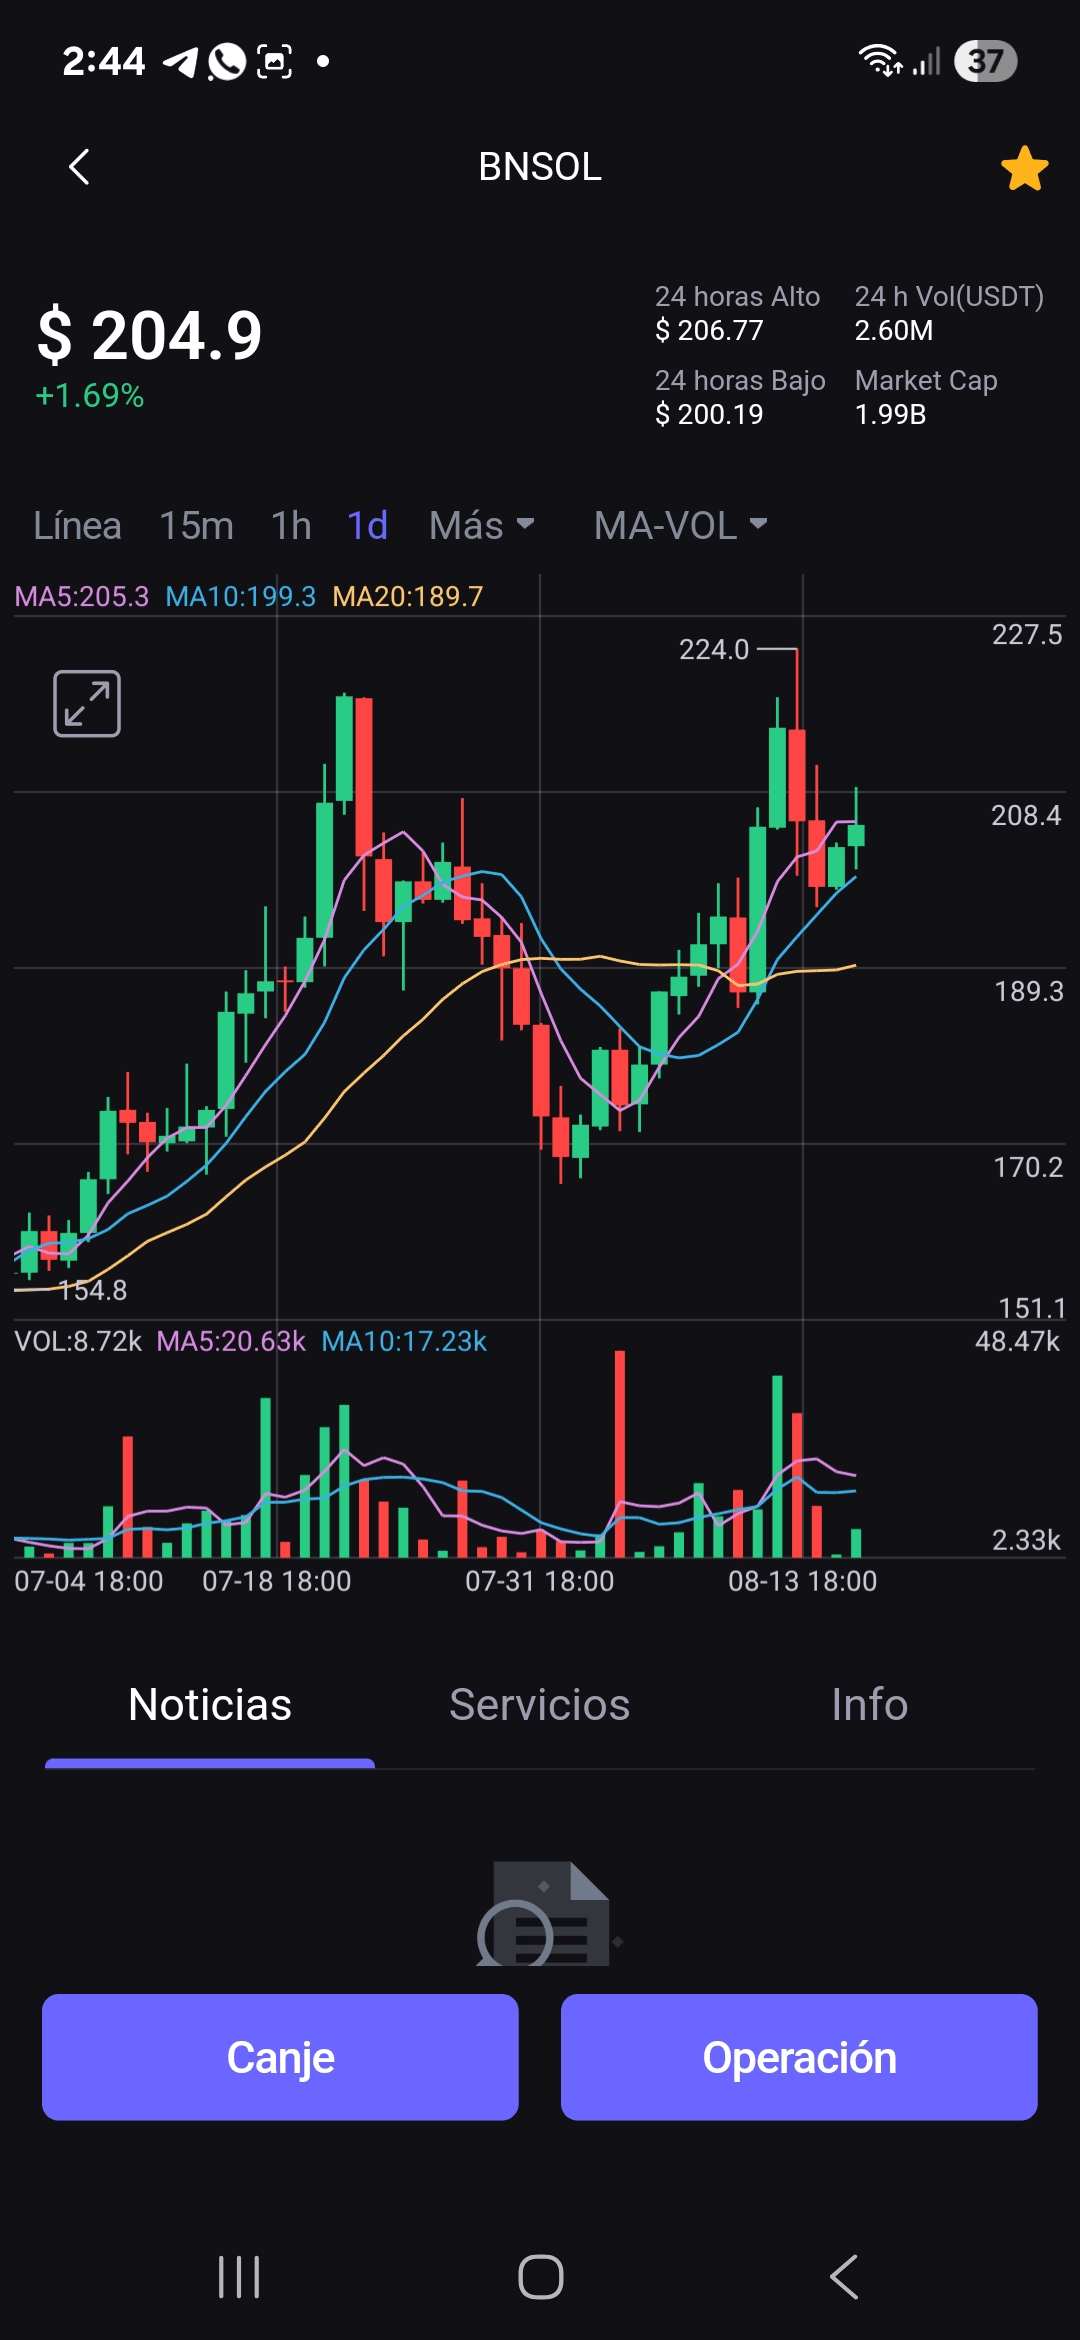
Chart 1 (Image 1000053803.jpg):
* Timeframe: 1D (from July 4 to August 17).
* Price Movement: An uptrend is observed since July 4, with the price rising from $154.8 to a peak of $224.0 around August 13, and then retracing to the current price of $204.9.
* Moving Averages (MA):
* MA5 (5-day Moving Average): $205.3
* MA10 (10-day Moving Average): $199.3
* MA20 (20-day Moving Average): $189.7
* The moving averages are aligned in a bullish configuration (MA5 > MA10 > MA20), suggesting that the short and medium-term bullish trend is still intact.
* Volume (Vol): The volume has been variable, with significant spikes, especially around August 13, when the price reached its peak. This indicates strong trading activity at that time.
Chart 2 (Image 1000053804.jpg):
* Timeframe: 1D (from May 16 to August 17).
* Price Movement: Shows a downward or sideways trend since May, followed by the bullish surge observed in the other chart. The price dropped from $197.5 to $133.3 before starting the rise.
Analysis of the "Ceiling"
* Identification of the ceiling: The "ceiling" or most significant resistance level that can be identified in the 1D chart is the peak of $224.0, reached on August 13. This is the highest point the price has reached in the recent period and, therefore, is the main resistance level to overcome.
Conclusion
Based on the analysis of the two charts:
* The overall medium-term trend (since July) is bullish. The moving averages confirm this, as the short-term moving average is above the long-term ones.
* The current price of $204.9 is relatively close to the resistance level of $224.0. This indicates potential for the price to move towards that level.
* The trading volume around the peak of $224.0 was significant. This is a sign that there was a strong battle between buyers and sellers at that level. If the price approaches $224.0 again, it is likely to encounter considerable resistance, as sellers may be waiting to take profits.
Forecast:
* It is likely that BNSOL will head towards the resistance level of $224.0 in the near future. The strong momentum of the bullish trend and the fact that the price is above its moving averages suggest that buyers are likely to attempt to reach that level.
* If BNSOL manages to break and close above $224.0 with considerable volume, it would be a very bullish signal. This could indicate a continuation of the trend and the establishment of new highs.
* If the price fails to surpass $224.0 and retraces, a "double top" pattern could form, which may indicate a reversal of the short-term bullish trend.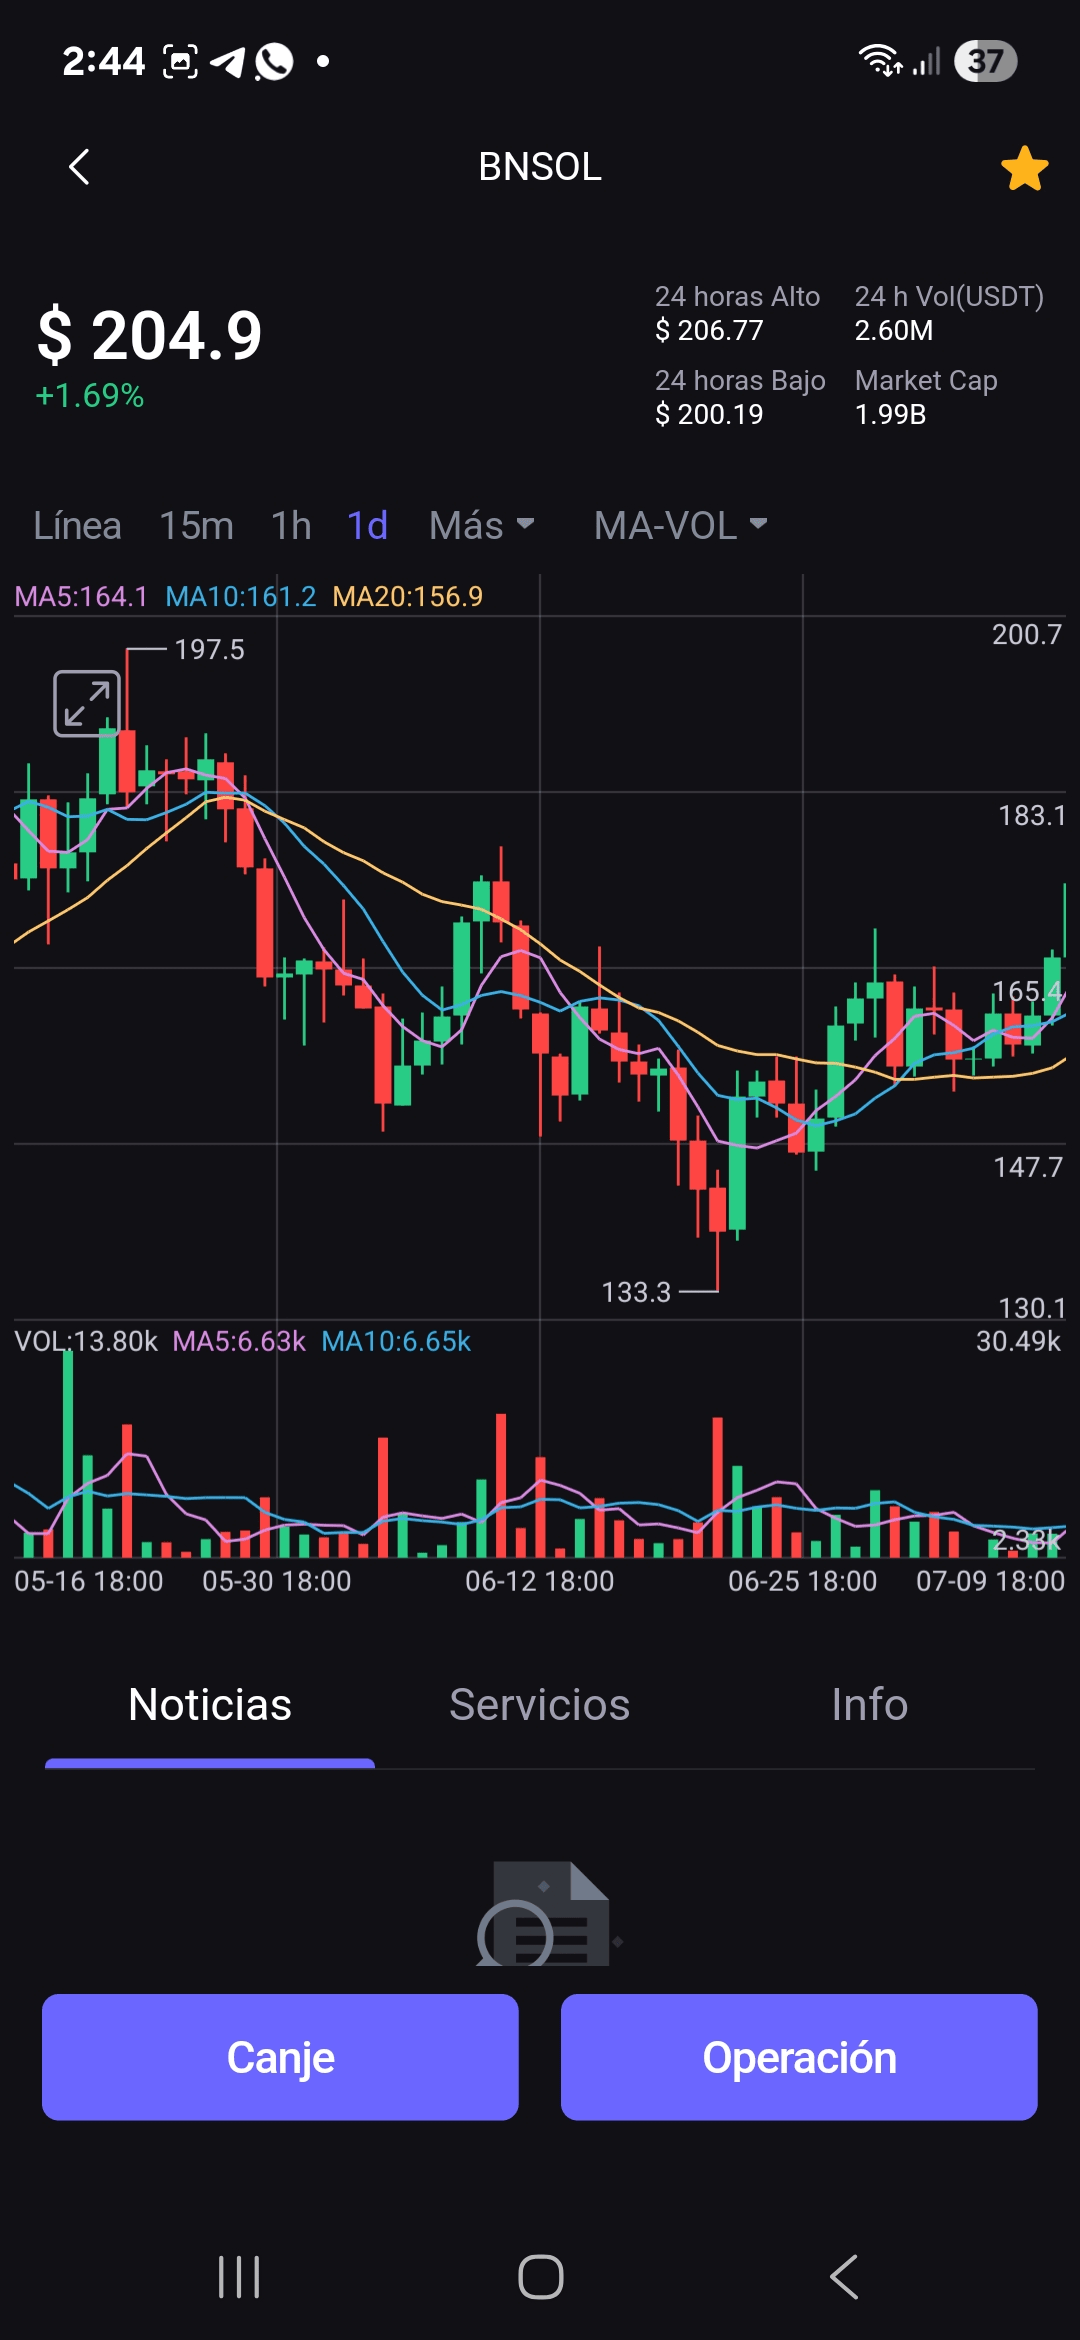
 e "double top", which could indicate a reversal of the short-term bullish trend.
In summary, there is a high probability that BNSOL will approach the "ceiling" of $224.0, but whether it will break through or not will depend on the strength of buyers and trading volume at that time.
$SOL #
