1. Technical Analysis
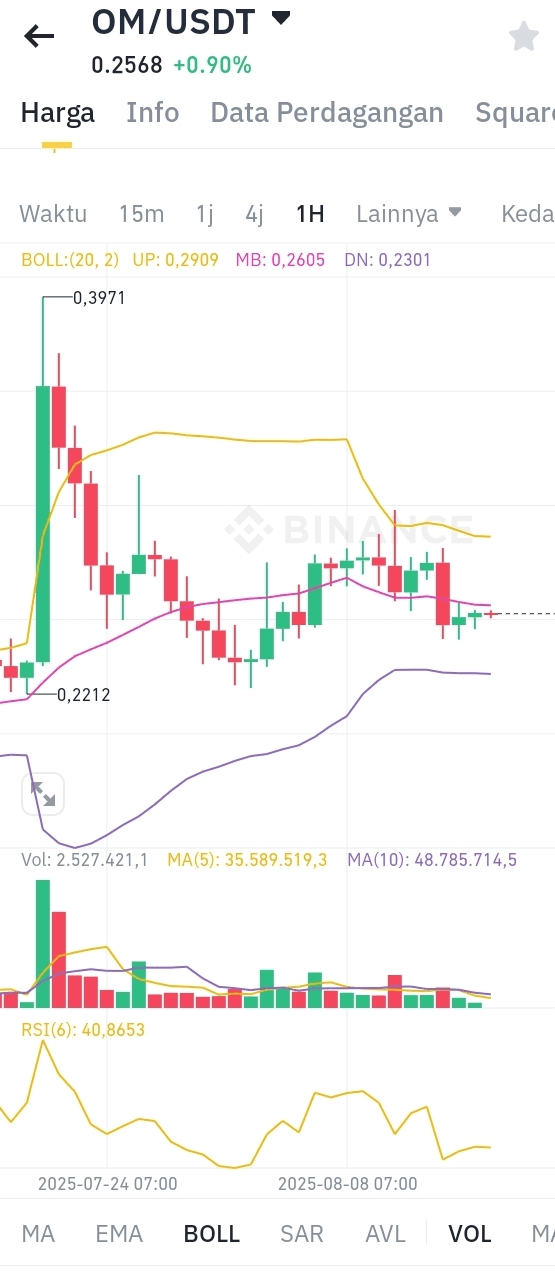
Current Price: 0.2568 USDT (+0.90% in 24 hours).
Bollinger Bands Indicator (20,2):
Upper Band (UP): 0.2909 (resistance).
Middle Band (MB): 0.2605 (key level).
Lower Band (DN): 0.2301 (support). The current price is between MB and DN, indicating dominant selling pressure but potential rebound if it bounces from DN.
Trading Volume:
24-hour Volume: 2.527M OM (low vs MA5: 35.589M and MA10: 48.785M). Low volume indicates a lack of market participation, confirmation of breakout is needed.
RSI(6): 40.86 (neutral-tending weak). If RSI drops below 30, it could be an oversold signal for a rebound.
Moving Averages:
Price below MA5 and MA10, short-term bearish trend.
Historical Performance:
Significant decline over 180 days (-96.49%) and 1 year (-72.95%), indicating a long-term bearish trend. However, a rise in 30 days (+11.94%) could be the start of a recovery.
2. Trading Strategy
A. For Short-Term Traders (Scalping/Day Trading)
Buy Scenario (Bounce from Support):
Entry: If the price touches 0.2301 (Lower Bollinger Band) with confirmation of a green candle and RSI > 30.
Profit Target: 0.2605 (Middle Band) or 0.2909 (Upper Band).
Stop Loss: Below 0.2300 (example: 0.2250).
Sell Scenario (Breakdown Support):
Entry: If the price closes below 0.2301 with high volume.
Target: 0.2000 (psychological support).
Stop Loss: Back above 0.2350.
B. For Medium-Term Traders (Swing Trading)
Accumulation:
Buy gradually around 0.2300–0.2400 if RSI approaches 30 and volume increases.
Target: 0.2909 (Upper Band) or 0.3000 (psychological resistance).
Stop Loss: 0.2200.
Breakout:
If the price breaks above the Upper Band (0.2909) with 2x average volume, it could continue to 0.3500.
C. Risk Management
Use a minimum risk-reward ratio of 1:2 (example: risking 1% for a target of 2%).
Avoid trading when volume is very low (like now) as it is prone to manipulation.
3. Fundamental Factors & Sentiment
Potential Catalyst: Monitor news related to the OM project (upgrades, partnerships, or new listings).
Market Cap & Liquidity: Ensure there is enough liquidity for easy exit.
4. Recommendations
Avoid large trades until there is confirmation of breakout/breakdown or an increase in volume.
Monitor RSI and Bollinger Bands for reversal signals.
Use automatic stop loss to avoid large losses.
Disclaimer: This analysis is based on historical data and technical indicators. The risk of trading cryptocurrency is high, make sure to do your own research.