I always tell the people around me: since August 3rd, the 'root' of this market has actually changed.
It's not just my wild guess; it's based on closely watching and reviewing the market during this period, with four solid signals pointing towards this direction.
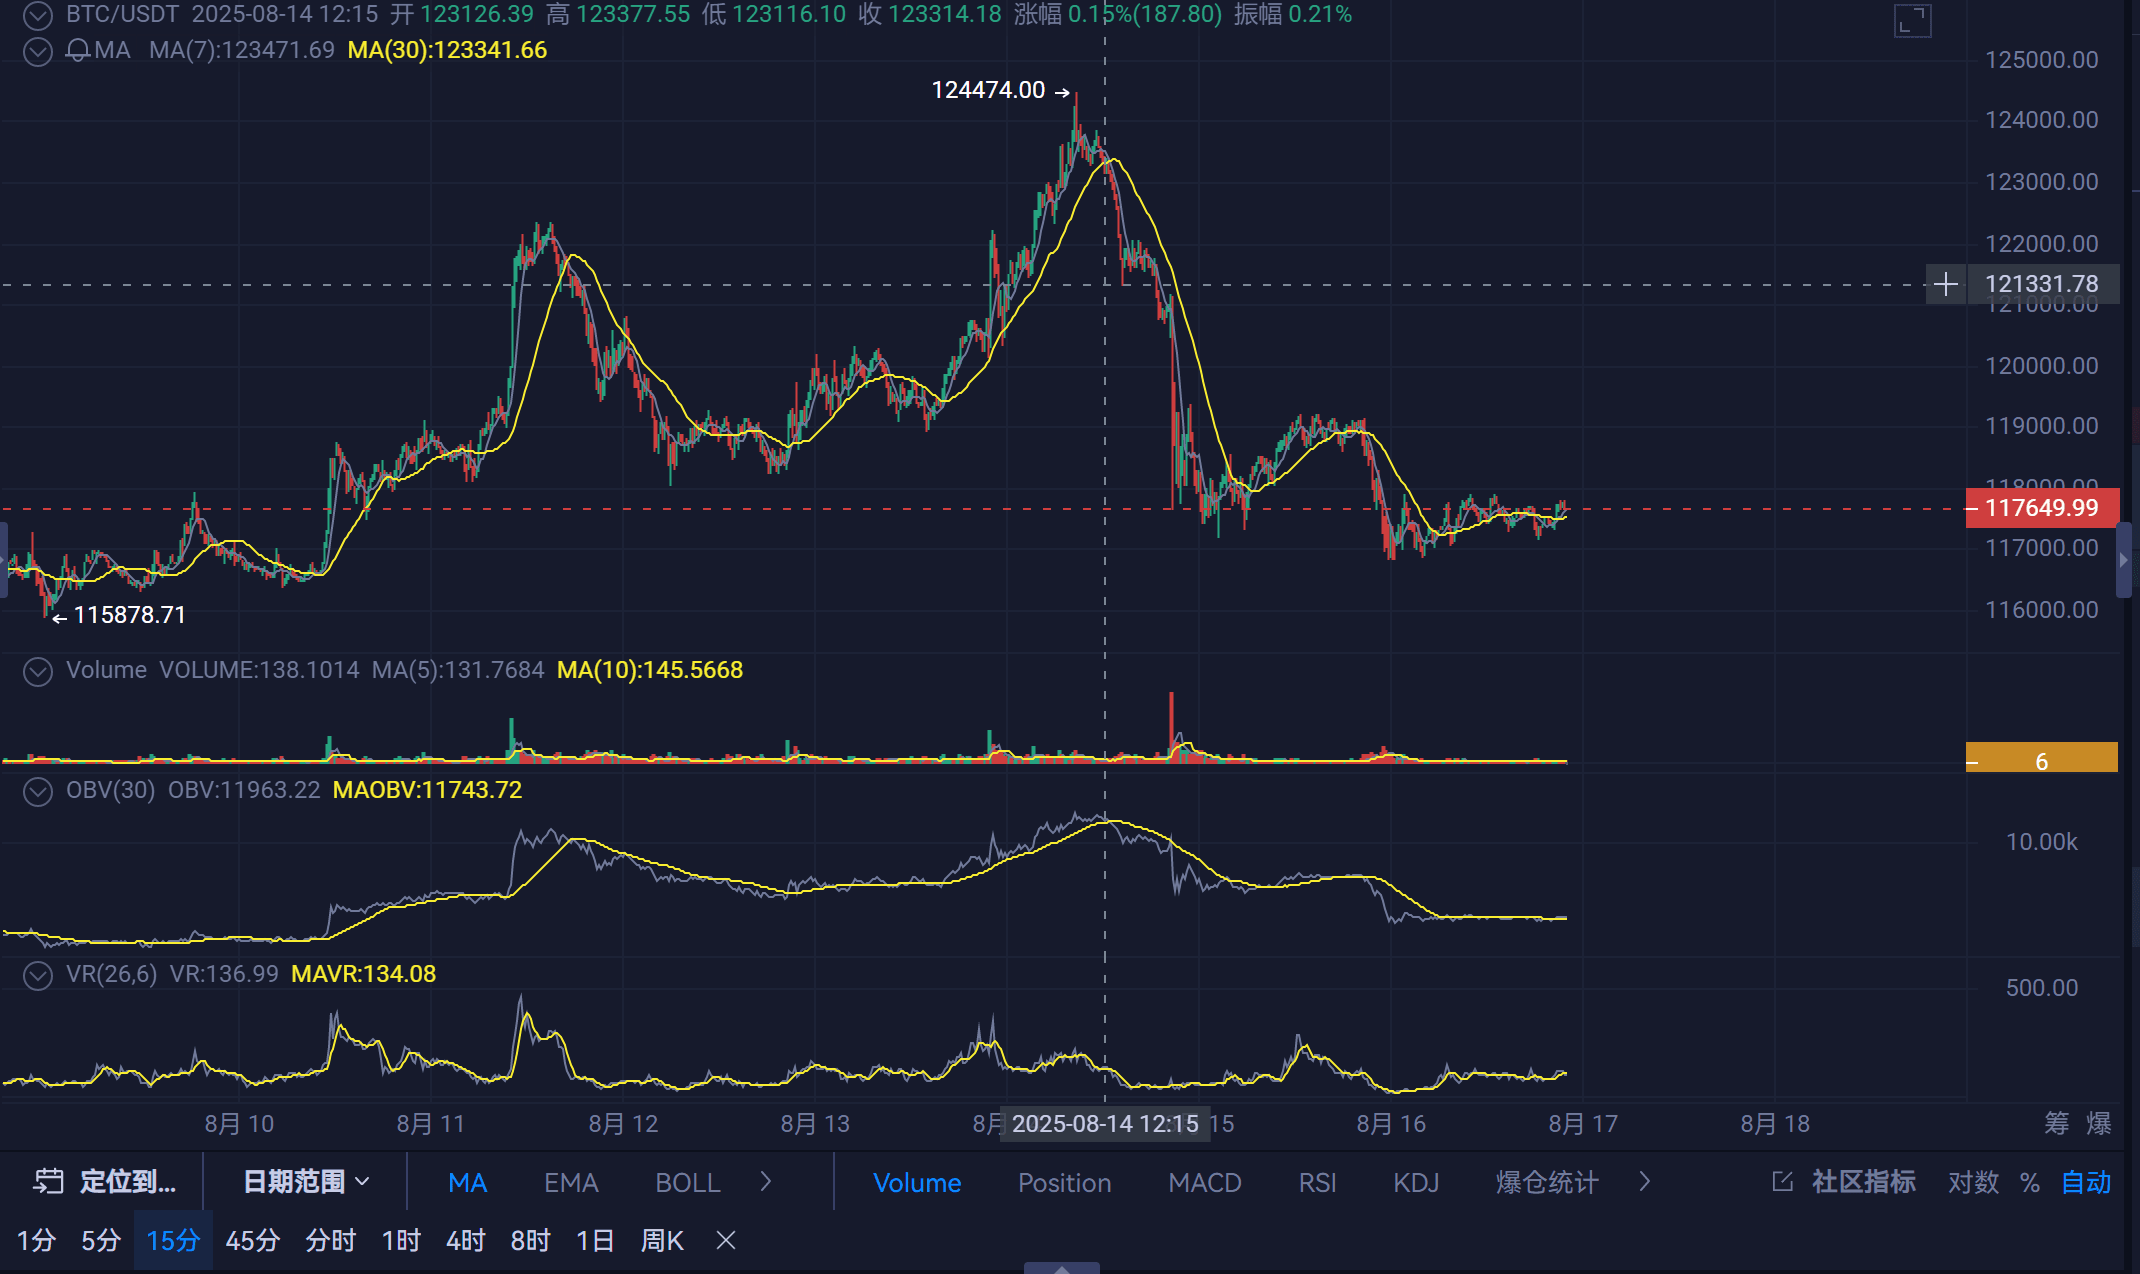
First of all, the market's 'toughness' is long gone. Do you remember? After April 10th, BTC's trend was extraordinarily strong, no matter what kind of pullback signals appeared, it seemed as if they were invisible. That kind of arrogance of 'not dropping' can only be truly felt by those who watch the market in real-time—looking back at the candlestick chart afterwards, one cannot comprehend the overwhelming strength at that time. The last time the market was so fierce was starting from October 11, 2024, and it didn't settle down until December. But this time, August 3rd was a clear turning point; any subsequent rise felt hollow and weak compared to the previous relentless momentum. It was obvious to the discerning that the strong cycle had broken.
Moreover, the current trend is almost identical to that of December 17, 2024; it's definitely not a coincidence. Think about it, first look at the response to negative news—on December 17th, the market saw a massive drop due to the 'Fed pausing rate cuts.' Normally, when the Fed releases negative news, like on July 31st, the market usually drops sharply first, then the main players quickly pull it back up to 'trap shorts,' with real declines often waiting until the third day. But the December 17th event was exactly like this one: when the negative news came out, it was genuine bad news, and the price dropped straight down, not giving any chance for a rebound or any room for hope. Additionally, the candlestick patterns from August 14 until now, regardless of whether you look at the 15-minute or 4-hour charts, the rebound's strength and movement closely resemble that wave after December 17th, almost like a copy-paste job. Even the segments after the new high are similar; back then, it dropped from around 104,500 to 108,000, and this time's rhythm is quite similar.
There are also technical indicators, several cycles have long been showing divergence, and the MACD on the weekly and daily charts is about to death cross. If you look back at the old accounts of BTC, you will know that whenever a strong bullish moving average dies, even if there is a rebound afterwards, it is bound to come back with an even fiercer crash. This is not just a casual reference, it's a reliable basis. If you want to delve deeper, I can find more indicators to corroborate this.
Finally, let's talk about the institutions' intentions; the current trend aligns with their logic of shaking out or unloading. From the perspective of Bitcoin's halving cycle, historically, this is the stage where the main players start 'rearranging their chips'—pulling a wave of market activity to lure in those chasing gains, and then crashing the market hard and fast, creating panic to either shake off the indecisive or unload directly, so they can buy back at a lower price. Looking at the Fed's rate cut rhythm, the trend around the rate cut in September 2024 is very clear: initially, there are expectations for a rate cut, and institutions first push the price up to attract funds; once the rate cut actually happens, the price hovers at a high level, even crashing down along with it, harvesting the last ones who chased after the good news. The current situation is almost identical to these two rhythms.
So I think the key support level is hanging in the balance. If we calculate based on time, the probability of holding at 117,000 is even smaller than during the day. On Monday, there’s a high probability of forming a local arc top at the 4-hour level, with the next support between 115,000 and 116,000. If this level breaks, it could lead to a new round of a massive drop. Of course, in the past, significant drops required time to play out; for instance, in February 2025, it started from around 95,000 and took almost a month to oscillate around the middle price, with about 21 days to set up the shorts. But this time is different; the rhythm is clearly faster, likely aiming to quickly clear high-leverage positions and harvest a wave of segment profits, so the 100,000 integer level is unlikely to break easily.
In summary: if my judgment is correct, next week, the line at 115,000 will definitely not hold; if it does hold, then the market may start to sweep up and down again, oscillating back and forth to squeeze out both long and short positions.
#BTC
#MarketTurbulence #TariffPause #SwingTradingStrategy #BinanceHODLerTree

