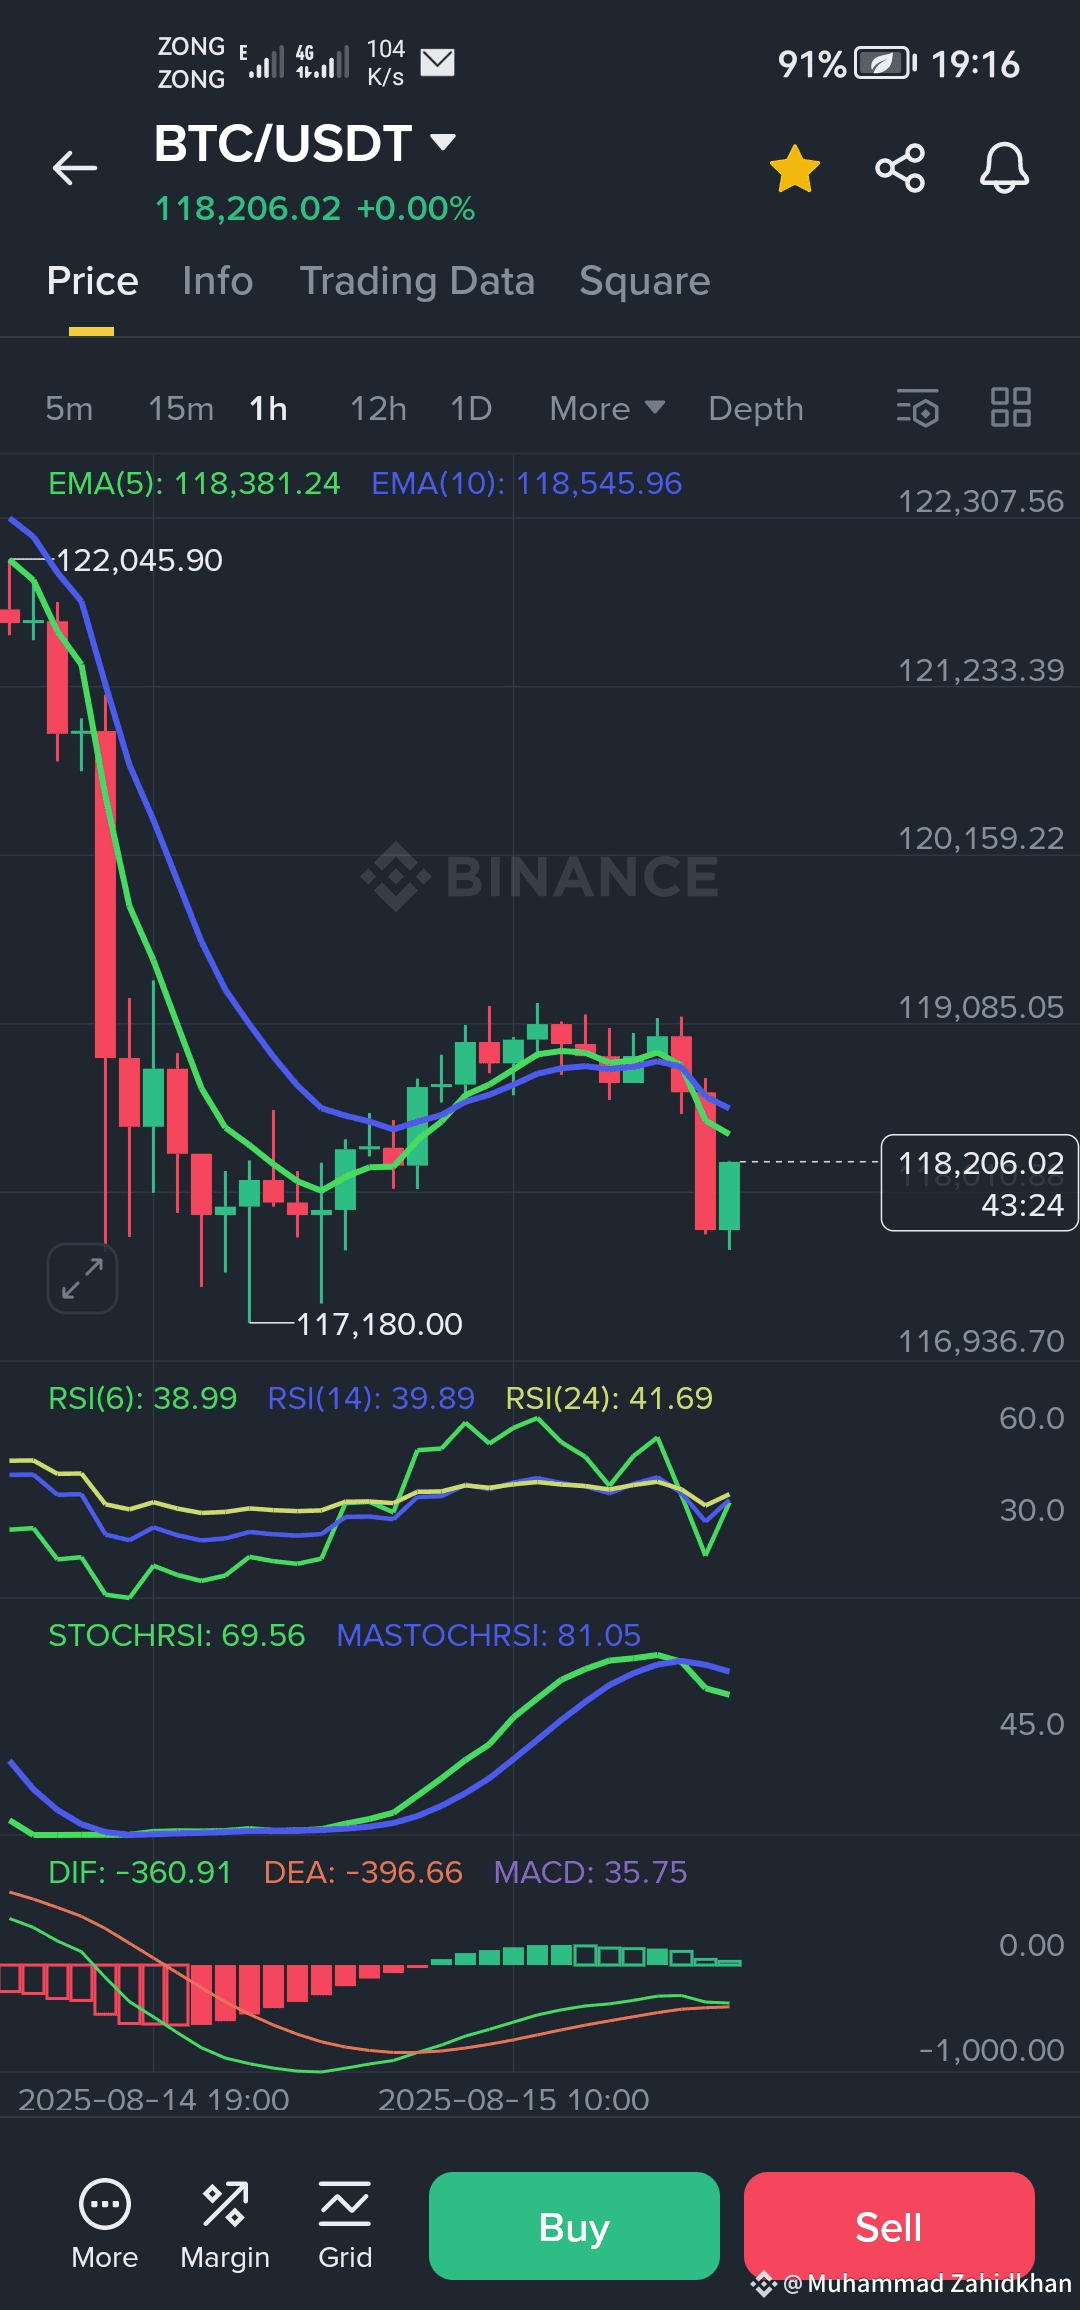
- Price is near 118,206, showing a recent downtrend starting from 122,045.
- EMA(5) (green) below EMA(10) (blue) signals bearish momentum.
- RSI values (around 38-41) are below 50, indicating weak buying pressure.
- StochRSI is high (~69), close to overbought, suggesting possible short-term pullback.
- MACD histogram shows decreasing negative momentum, hinting potential reversal soon.
Advice:
- Likely short-term down or sideways movement persists.
- Consider a cautious buy if price holds above 117,180 support.
- TP (Take Profit) around 119,000 - 120,000 zone if rebound occurs.
- SL (Stop Loss) just below 117,000 to limit risk.
It’s a mixed but slightly bearish scenario; watch for confirmation before big moves.
Lets do trade as per the above mentioned trade plan by clicking the chart, I do hope you will be successful.
Like, follow and share this article🙏🙏🙏
Check my facbook page to contact me personally:
https://www.facebook.com/share/1BokCUQTsg/