To survive in the crypto world for a long time, besides having the ability to analyze various technical indicators and accessing first-hand information, you also need to manage your positions effectively. The following position rolling method is a relatively stable strategy I summarized over 10 years in the market (I suggest everyone like + save it to avoid losing it later), now onto the good stuff:
I firmly believe that trading charts must remain simple and reasonable, making trading decisions based on the raw price movement data. This way, traders can avoid unnecessary indicator distractions. I do not need any indicators or EA to make trading decisions; I always focus on the initial price movements of currency pairs, commodities, etc. I believe price action is one of the closest, most reliable, and profitable ways to trade.
I have always been this way for the past 10 years, and I will continue to be so in the future. Price action is the way!
A simple and understandable price action trading strategy for a ranging market.
I like to keep everything simple and clear, including ranging markets.
A so-called ranging market refers to when the price is trapped between a support level and a resistance level, oscillating back and forth between these two boundaries.
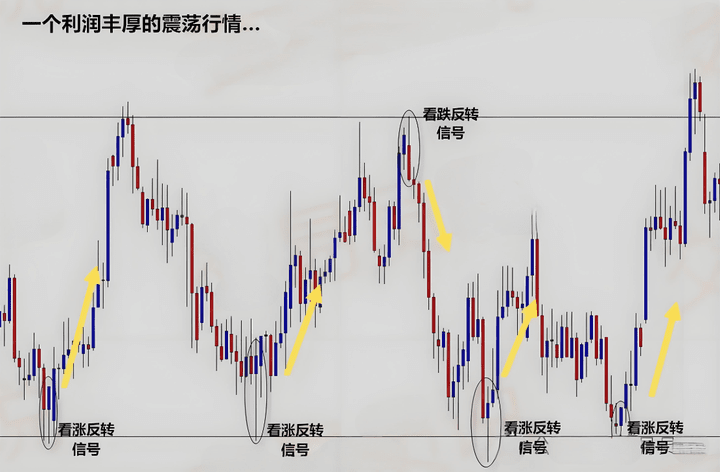
Here is a typical chart of a ranging market...
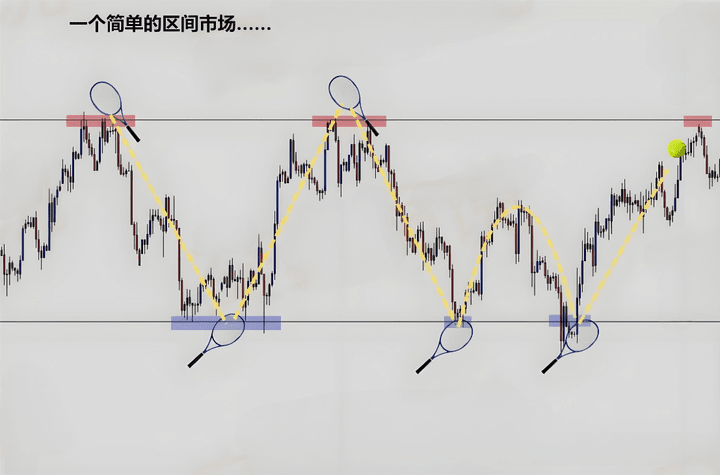
The best practice is to focus on the upper and lower boundaries, looking for price action signals that suggest a price reversal is imminent.
Let's take a look at this example of a ranging market:
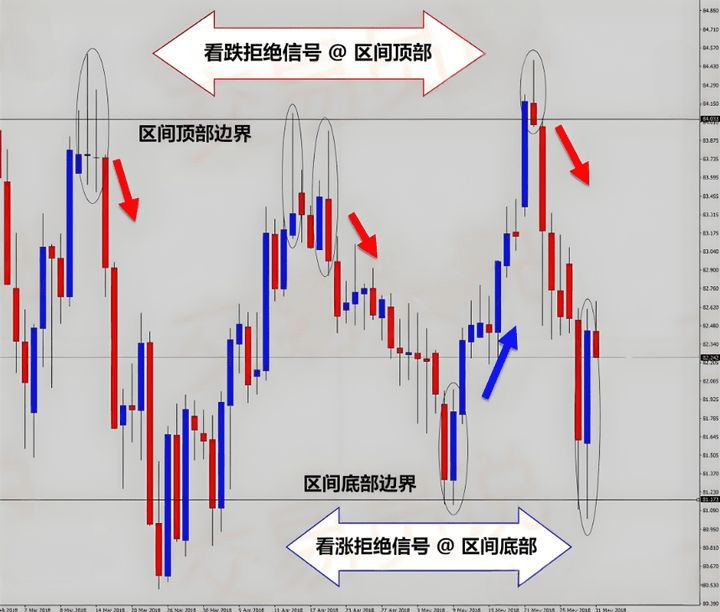
You can clearly see this is a ranging market, as there are two distinct boundaries in the chart, and the price is oscillating between them.
Please note: multiple bearish rejection signals appeared at the upper boundary, while multiple bullish rejection signals appeared at the lower boundary—these signals indicate that the price may reverse at the boundaries.
These signals are early warning signs of a new round of oscillation cycles.
In the chart above, I captured a significant bullish rejection signal appearing at the moment it was at the bottom of a range. Which direction do you think the price will go next?
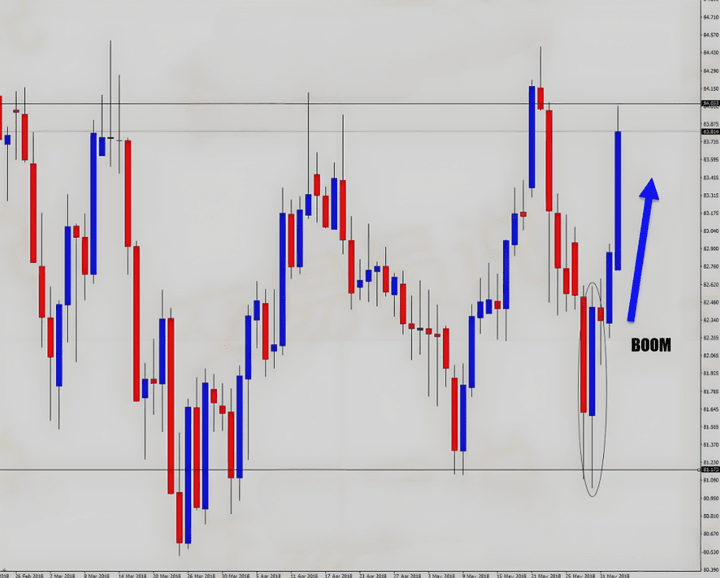
If your guess is 'up,' then you're great.
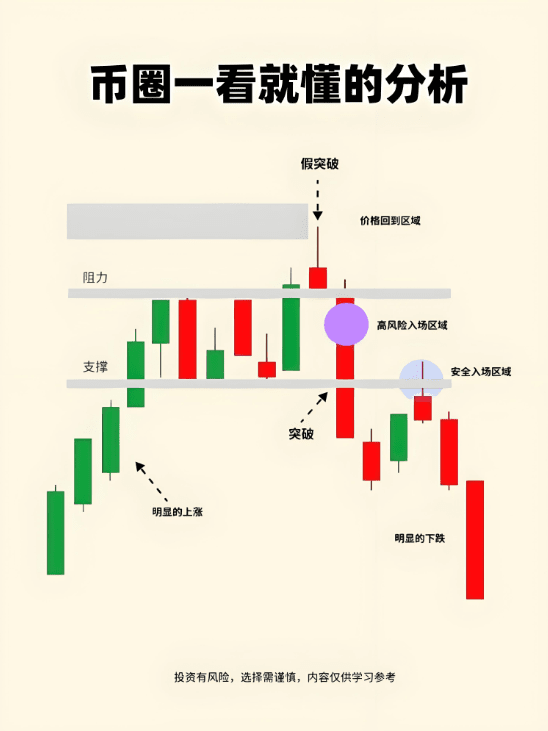
It's that simple—you only need to trade at the boundaries of the range to get the best trading opportunities. Trying to trade 'breakouts' in a ranging market is another matter! It's very difficult—the market often deceives you near the boundary, making you think it's about to break out when it actually isn't.
This situation is called a false breakout or 'fake move.' It's very common at the top and bottom of ranges, and even experienced traders can easily fall for it—so just focus on trading the 'rebound' opportunities at the boundaries of the range.
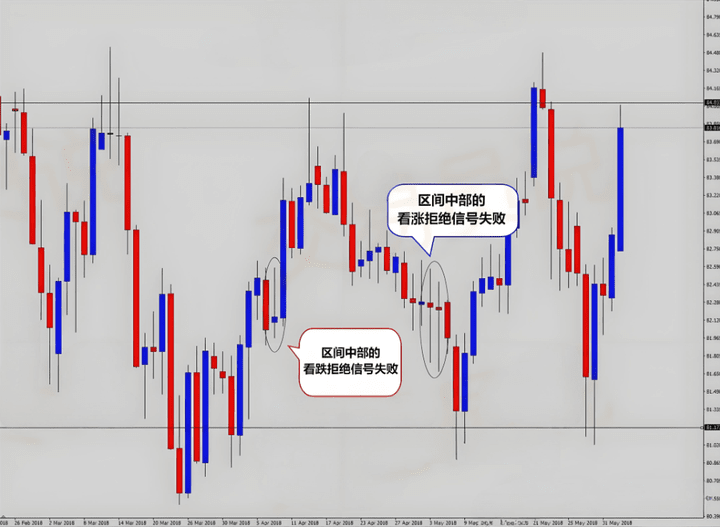
But what about the middle region of the range? Wow, be careful—it's a minefield there...
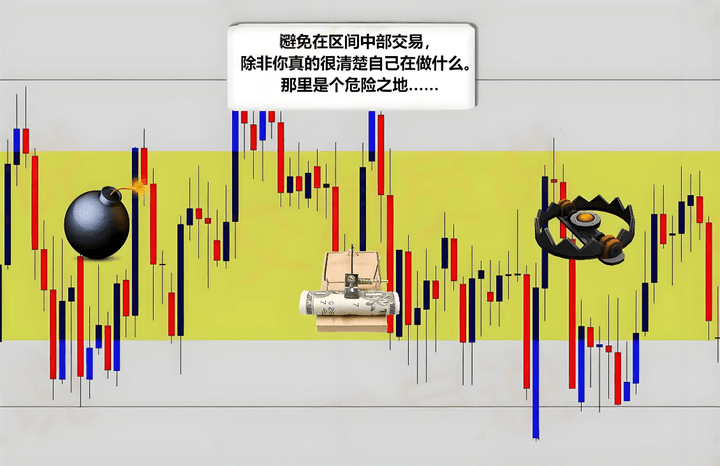
Let's take a look at the signals in the middle regions of the range...
Trading in the middle of a range is like dancing in fire.
Ranging markets are simple in themselves; do not complicate them.
A ranging market is a simple market structure. When looking for trading opportunities in a range, you should seek evidence of price showing intent to reverse at the top or bottom of the range. Bullish reversal signals at the bottom, bearish reversal signals at the top. Do not easily venture into the middle area of a range—it's a dangerous minefield!
The secret to identifying trends and how to trade in their favor
How to determine market trends? This is a question that is often overanalyzed and taken out of context, especially common in various public discussions.
Due to the chaos and divergence, no one can give a definitive answer. But the answer is right here:
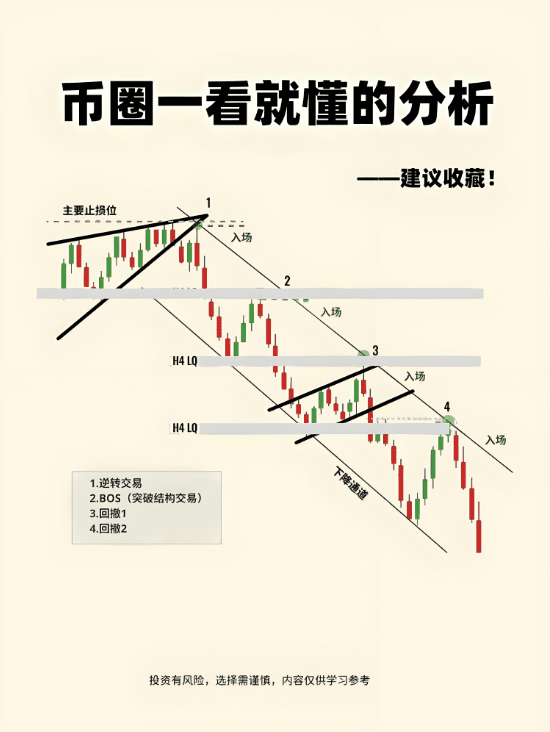
What you need to observe is the trajectory of price swing highs and lows.
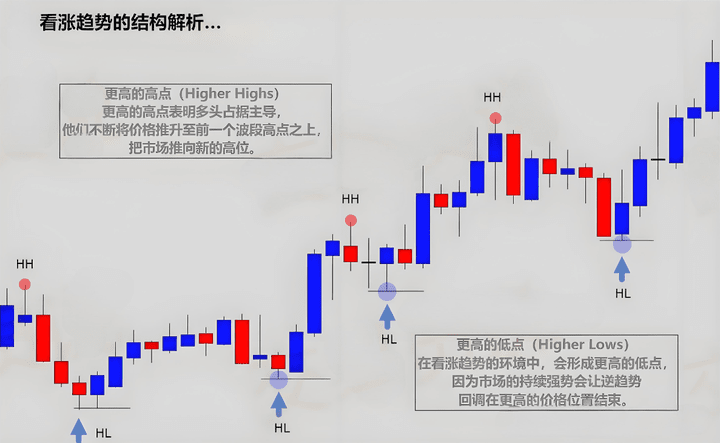
A bullish market will form higher highs (HH) and higher lows (HL)
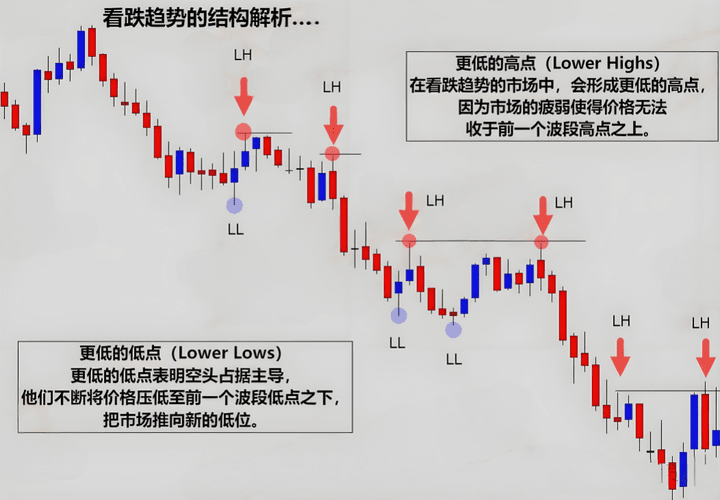
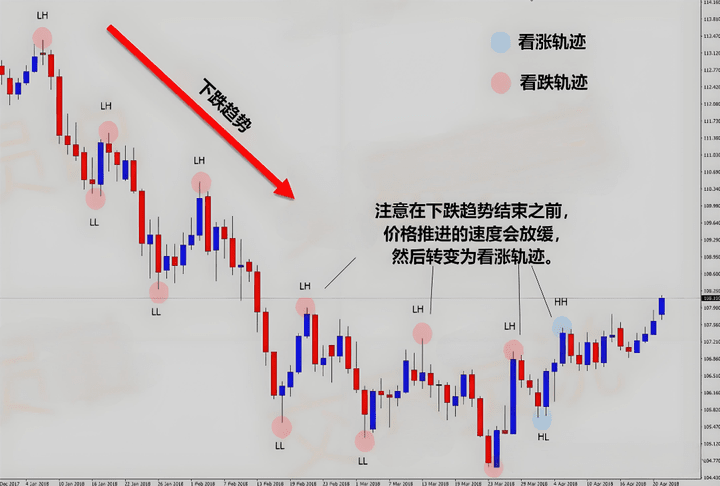
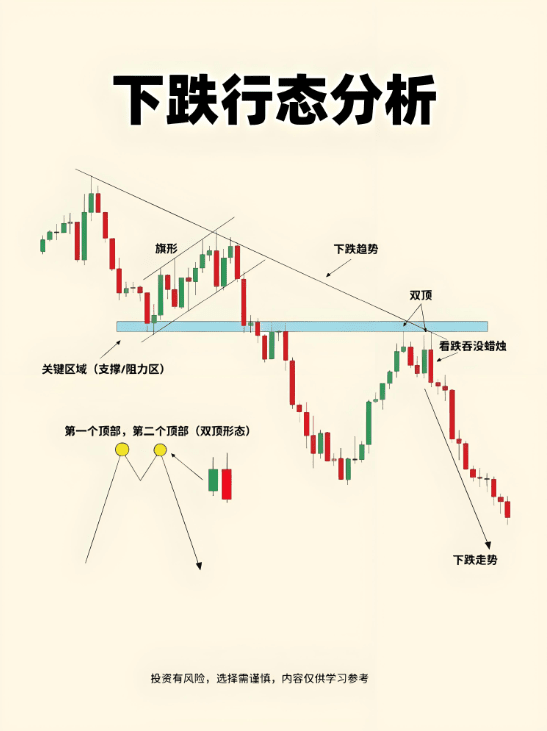
A down market will form lower highs (LH) and lower lows (LL)
Bullish trend structure:
Bearish trend structure:
If you don't see this structure on the chart, then the market has either stopped trending or was never in a trend to begin with.
You can also identify potential trend reversal moments by observing these 'swing turning points'...
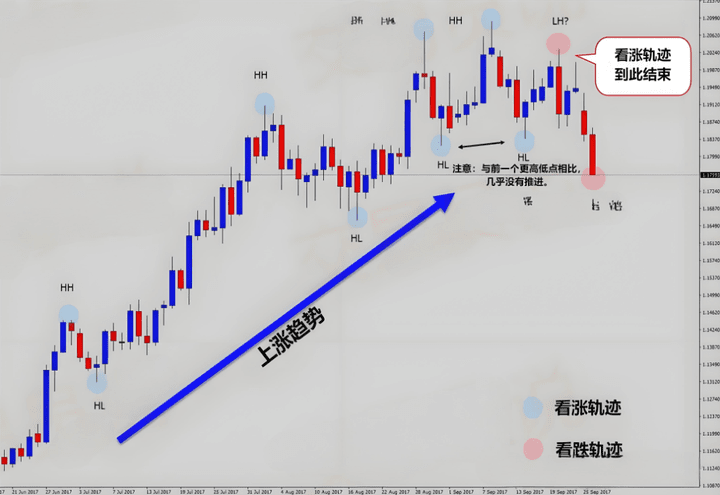
As shown in the chart, the price action here defines a standard uptrend condition with higher lows + higher highs.
But also pay attention to warning signals—it's observed that the rhythm of the highs and lows is slowing down, indicating that the trend may be exhausting.
After the trend slows down, signs of weakness begin to appear in price action. Hmm... is there a hint of a bearish trend starting? These first-hand signals are what you need to pay attention to.
Being able to identify these subtle structural changes will make you stand out among many technical analysts—because almost no one pays attention to these key details!
To better understand, let's look at an example of a bearish trend:
I found that many traders like to use various indicators to determine trend direction—there's really no need; the most critical information is in the chart itself.
Swing structure analysis can help you determine not only whether a trend exists but also identify trend strength and potential reversal hotspots.
Now, 'identifying trends' has never been so simple!
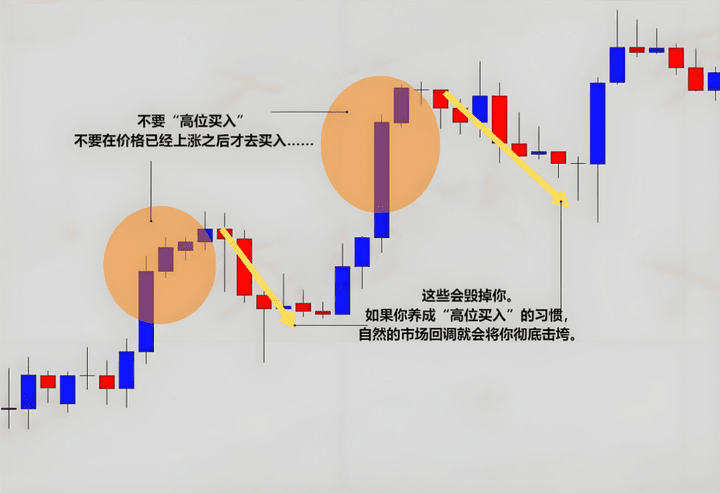
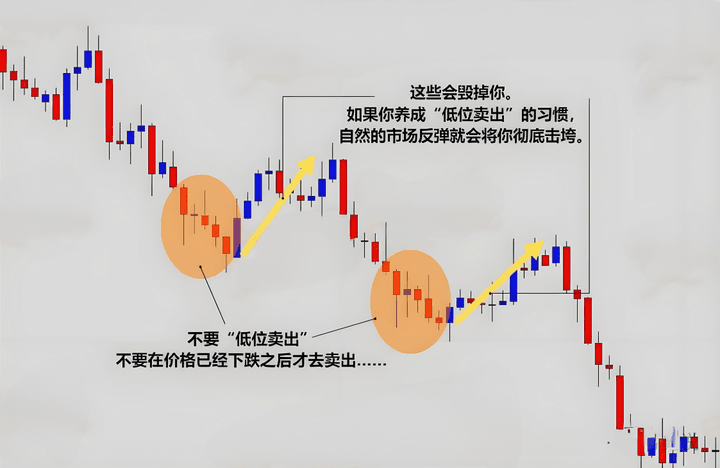
The 'golden rule' of trading is 'buy low, sell high.' It sounds simple, but why do so many traders still buy at extreme highs or sell at extreme lows?
When traders go against the trend (buy high, sell low), the following situations occur:
Buying at high levels in an uptrend → getting trapped at the top
Chasing shorts at lower levels in a downtrend → crashing to the floor
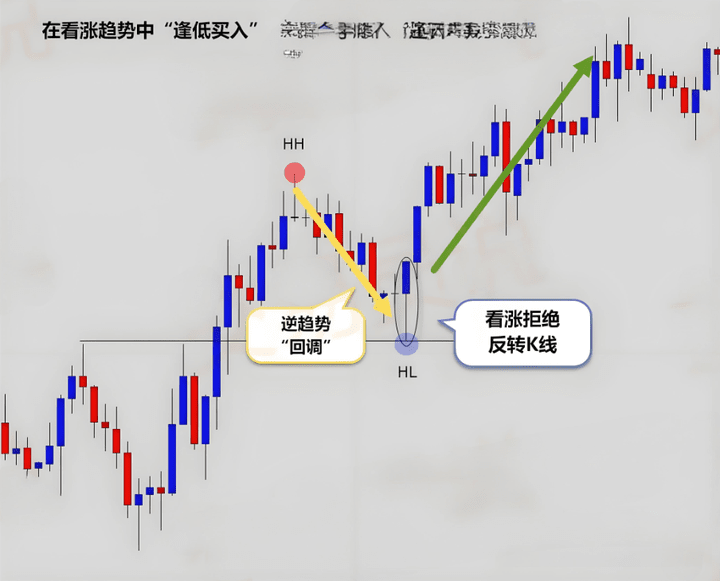
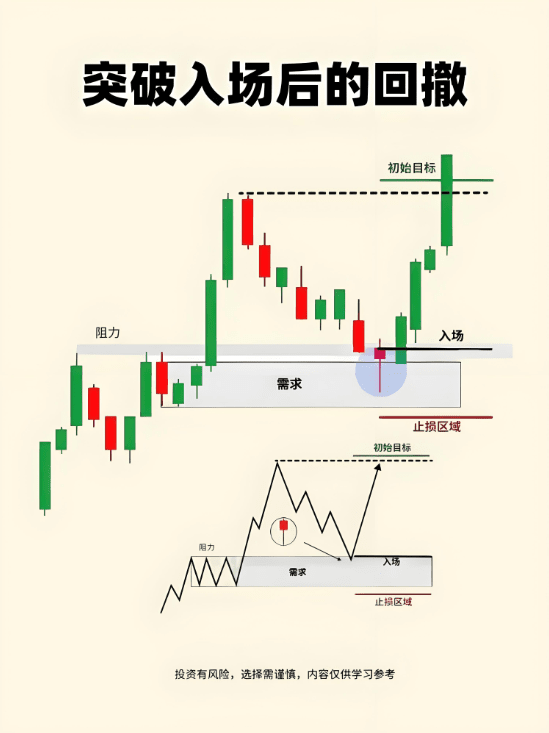
Remember a classic saying: 'Buy the dips in an uptrend, sell the rallies in a downtrend.'
This widely circulated trading maxim accurately encapsulates how to correctly position in a trend while avoiding the risk of being stopped out by pullbacks.
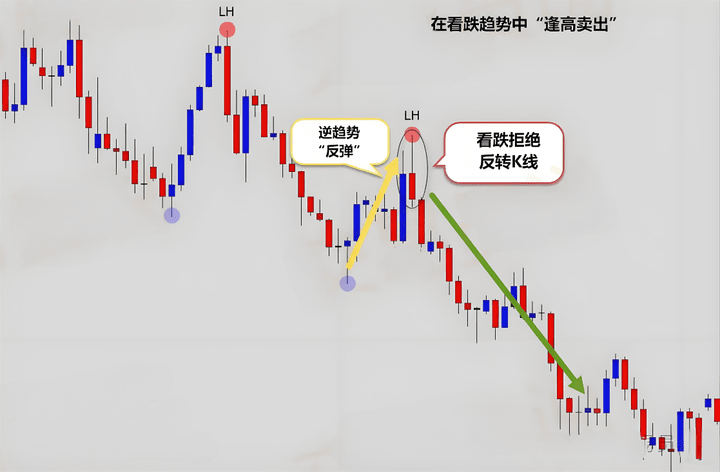
If the market is in a downtrend, a brief rally is your shorting opportunity; if the market is in an uptrend, a brief pullback is your buying opportunity.
Example chart:
Buy on pullbacks in an uptrend
Sell on rallies in a downtrend
Sometimes, going back to the basics is the most important thing. You need to truly understand what a trend is.
This is exactly why price action is the best way to assess market structure; you can see at a glance whether the market is in a trending state.
Trends are actually quite simple—like a staircase market structure. You don't need a bunch of strange indicators to tell you the direction; just apply the trend identification rules discussed in this lesson, and you can judge the trend state yourself.
Summary
You don't need any indicators to determine trends! All the answers are in the price action itself, and it's not hard to read.
The main reason traders fail to enter trades is that they cannot correctly assess whether the market is in a trend or they trade signals from the 'wrong position' in the trend. Please use swing structure analysis to determine if the market is in a trend, the direction of the price, and the strength of the trend.
Remember this golden rule: 'Buy low in an uptrend, sell high in a downtrend.'
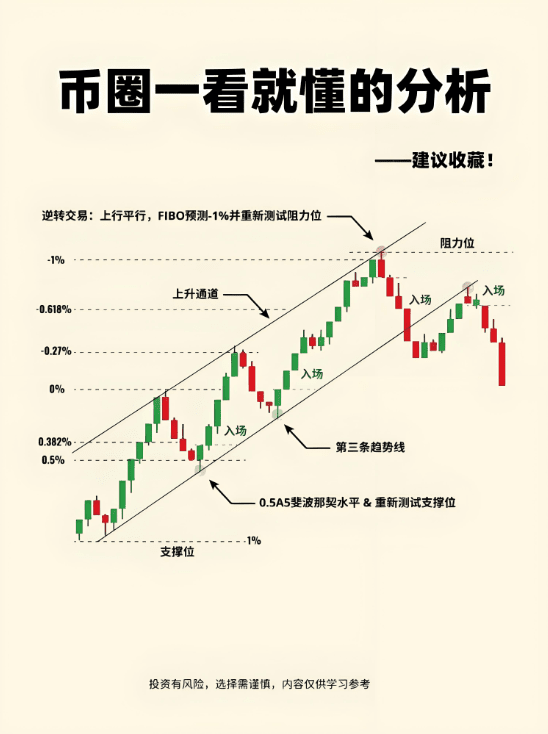
Next, I will share a set of techniques! The simplest analysis that's easy to understand! The temperature line to control when making cakes.
Finally! The fifteen rules every trader must memorize!
One, protect your capital; survival is the first rule for investors;
Two, as long as you are not greedy, making money is simple, with stable small profits;
Three, do not diversify too much, never go all in, and trade in the direction of the trend;
Four, do not over-leverage, do not carry positions, and do not trade frequently;
Five, no rush to buy, decisive selling, and no dragging on stop losses;
Six, money can never be finished, but you can lose it all;
Seven, stop losses in a timely manner, exit unconditionally; stop losses are always correct;
Eight, short-term stability or long-term stability, securing profits is the safest approach;
Nine, the unchanging truth of the market is that extremes will reverse;
Ten, do not trade without a market; missing trading opportunities is normal; just capture part of it;
Eleven, waiting for trading opportunities is always a hundred times better than having trading opportunities;
Twelve, stop trading after completing your daily profit target; energy is limited.
Thirteen, stop losses are yours, profits are given by the market;
Fourteen, money comes from waiting, not from frequent trading;
Fifteen, mindset is fragile in the face of desire; trade strictly according to the trading strategy to achieve unity of knowledge and action!
Remember: there are many market opportunities, the key is to have the patience to stick to the rules. Adhere to these 15 rules, and after three months you will find that making short-term profits is not as difficult as you imagined.
No matter how diligent a fisherman is, he won't go out to fish in stormy seasons; instead, he guards his fishing boat carefully. This season will pass, and a sunny day will come! Focus on the feast, teaching you to fish and how to fish; the door to the crypto world is always open. Only by following the trend can you have a life of following the trend—save it and remember it!
