Technical & Sentiment Snapshot
Short-term resistance & momentum: ETH recently hit a new high near ~$4,750 and pulled back—the intraday high today was ~$4,783 .
EMA configuration: The EMA stack (20, 50, 100, 200) remains bullish, providing layered support beneath price .
Momentum indicators: RSI remains neutral (~60), not yet overbought, with Bollinger Bands expanding—both suggesting room for continued upside .
MACD: Bullish momentum persists, although there's slight weakening suggesting caution .
Volume & accumulation: Spot outflows from exchanges (around $55M on Aug 14) signal accumulation and reduced selling pressure .
Broader Market & Institutional Context
ETF inflows: On August 12, spot ETH ETFs logged ~$524M net inflows over six consecutive days, with BlackRock's ETHA leading ($319M) .
August 13 rally: Institutions (BlackRock, Fidelity, Grayscale) added $704M), with ETHA delivering $500M alone—highlighting strong demand .
Supply impact: ETF and corporate holdings now account for ~8% of ETH's total supply, up from ~3% in April—underscoring intensified institutional accumulation .
Longer-term outlook: Standard Chartered has raised its 2025 base-case forecast to $7,500, driven by sustained ETF flows and on-chain growth .
Bullish sentiment heating up: Some analysts are eyeing potential $6K breakout, and even $8K–$15K targets, if current momentum sustains past key resistance .
---
Trading Scenarios for the Next 12 Hours
Scenario Trigger & Levels Implication
Bullish continuation Price holds above ~$4,700 and pushes above $4,800 Strong institutional demand could fuel a rally toward $5,000+
Consolidation Price ranges between $4,650–$4,750 Market digests inflows—watch for volume confirmation
Pullback/test support Price dips below $4,650 May revisit ~$4,600–$4,550 zones before resuming upward
---
Key Levels to Watch Tonight (UTC)
Support Zones:
Near-term: ~$4,650–$4,700 (recent pullback zone)
Deeper: ~$4,550–$4,600 (EMA support and prior lows)
Resistance Zones:
Immediate: ~$4,800 (recent intraday high)
Breakout area: ~$4,870–$4,875 (consolidation resistance)
---
What to Monitor
EMAs: Watch for rebounding off EMA levels as a sign of resumed bullish momentum.
Candlestick & Volume: Strong green candles with above-average volume can signal continuation.
Sentiment Shifts: If RSI climbs near 70 or MACD continues to diverge positively, bulls may be in control.
ETF Flow Headlines: Any fresh institutional moves could trigger spikes—stay alert for news.
---
Summary (Next 12 Hours)
Trend: Market remains bullish with strong EMA alignment, continued institutional inflows, and accumulation signals.
Caution: Momentum indicators like RSI and MACD show signs of tapering—watch closely for consolidation or minor pullbacks.
Key Zone: Holding above ~$4,700 offers potential to lift toward ~$5,000. Weakness below ~$4,650–$4,600 may soften momentum.
Strategy Tip: Consider incremental entries near support and watch for volume-backed breakouts rather than chasing all-time highs.
---
TL;DR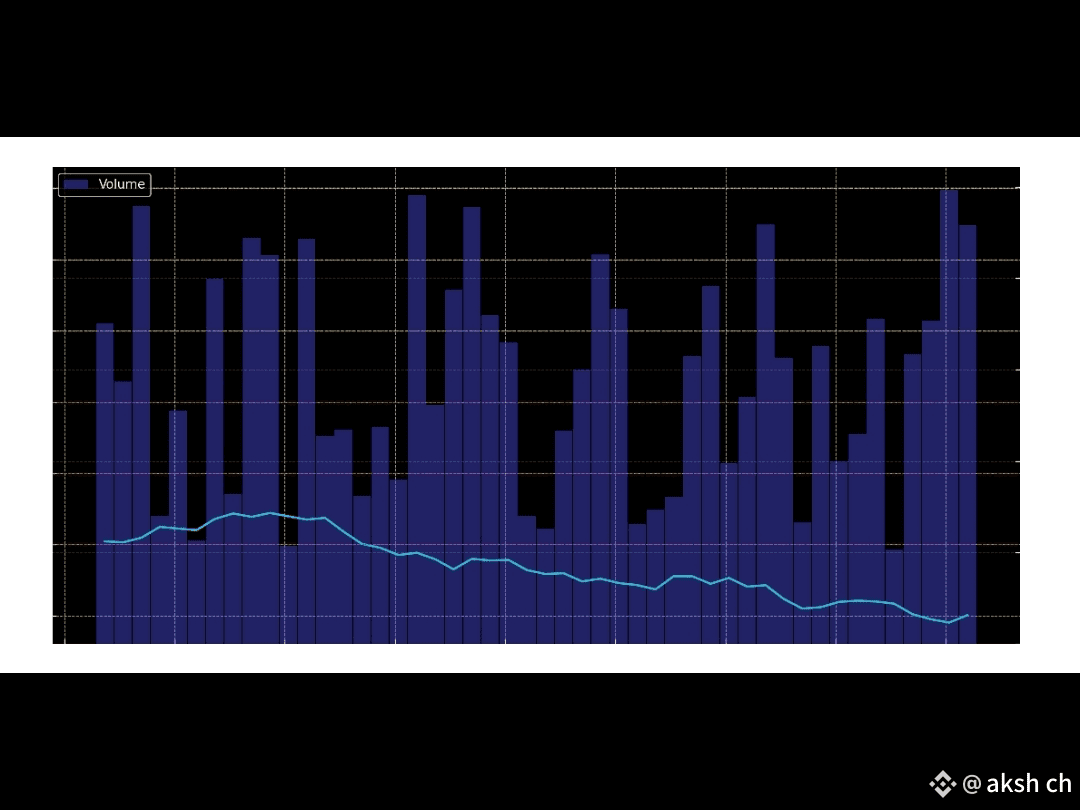
Trend: Still bullish, supported by institutional demand and technical structure.
Watch zones: $4,650–$4,700 for breakout bias; $4,550–$4,650 for support strength.
Action: Be prepared for possible consolidation—scale into positions with confirmation, and keep protective risk sizing.
---#createrpad
