After more than ten years of trading cryptocurrency, my wealth journey can be summarized as follows:
The first ten million took the longest and was the most painful, with the trading system constantly being reshaped and polished, taking a year and a half.
The second ten million took three months.
The third ten million took only 40 days.
The fourth ten million took only 5 days.
75% of the funds were earned in half a year.
My personal account took nearly 10 years to grow from 300,000 to 1 million, but once it hit 1 million, it seemed to open up, jumping straight to 40 million. Today, I share a few key insights, these experiences worth 60 million, hoping to help you.
Phase One: Space-Time Folding Infrastructure (0→5000U)
▎Time Vault (50% Capital)
Impulse Harvesting Technique:
Daily between 04:00-06:00 Beijing time (when European and American traders are closing positions + when Asia is still awakening), scan the 15-minute K-line of BTC/ETH for 3 consecutive low-volume dojis and immediately place an order to open a reverse position.
Operation: If there are consecutive dojis in the early morning, close positions before 08:00 (take profit at 3% or liquidate at a 2% loss).
▎Hedge Safety Net (30% Capital)
Scissor Arbitrage:
When the BTC perpetual contract funding rate exceeds 0.15%, simultaneously open long Binance BTC/USDT and short OKX BTC/USDC, capturing cross-platform funding fee differences.
Locking Rule: The rate falls back to 0.05% to automatically unlock, with a single arbitrage cycle ≤3 days.
▎Leverage Propeller (20% Capital)
3. Whale Sniping System:
Monitor single liquidation orders over 1000 BTC through CoinGlass, ambush reverse 10x leveraged orders at strong liquidation prices ±1%
Case Study: A whale placed a 1000 BTC short order at $48,000, setting a reverse long order at $48,480 for sniping.
Phase Two: Folding Enhanced Mode (5000U→20000U)
▎Four-Dimensional Grid Advancement
Emotional Resonance Grid:
Set up an asymmetric grid at the daily BTC level (3% increase interval, 1.5% decrease interval)
Sell 2% for every unit up and buy 4% for every unit down (against human nature to capture panic premiums)
Event Folding Technique:
48 hours before each Federal Reserve meeting, open positions simultaneously with 20% of the capital:
Multiple BTC Volatility Index (DVOL)
Short ETH/BTC exchange rate contract
Hedging Logic: When interest rate decisions trigger BTC volatility, the DVOL increase covers exchange rate volatility risk.
⚡ Ultimate Phase: Space-Time Collapse Sprint (20000U+)
▎Black Hole Engine (Brutal Version)
Liquidity Siphoning:
When the BTC/USDT spread on the exchange is <0.05%, initiate high-frequency hedging:
① Buy 10,000 USDT spot at market price → ② Instantly open a 10x short contract → ③ Capture spot premium to return to profit
Execution Requirements: API latency <50ms, daily trigger limit 3 times.
Doomsday Wheel Strategy:
Two hours before the quarterly contract settlement, monitor the top 3 out-of-the-money options with open interest:
If the open interest of call options surges by 200%, open a 5x short position (harvesting option market makers' hedging).
Folding Rule (Lifeline Clause)
Folding Dimension Lock: If a single loss reaches 2% of total capital, automatically initiate a 24-hour trading freeze.
Time Collapse Device: Disable leverage on Wednesday/Friday evenings from 20:00 to 22:00 (high frequency of main force dumping).
Spatial Tear Protection: Profits exceeding 50% must be extracted to a cold wallet, reinvestment is prohibited.
Observer Effect: Mandatory review at 19:00 daily, using Python to backtest daily strategy deviations.
This strategy innovatively combines cross-market data monitoring (CoinGlass liquidation orders), asymmetric risk grids (sell less when rising/buy more when falling), and settlement doomsday wheels (snipe options open interest) to achieve all-weather profit capture through dimensional folding.
I will share another set of my years of practical strategies, achieving an average win rate of 80%, which is quite a rare accomplishment in the cryptocurrency trading world.
Without further ado, let's get straight to the point!
In two years, I turned 3000 into over 10 million, relying on this (5-0 trading pattern).
If you read this article carefully, you will benefit for a lifetime!
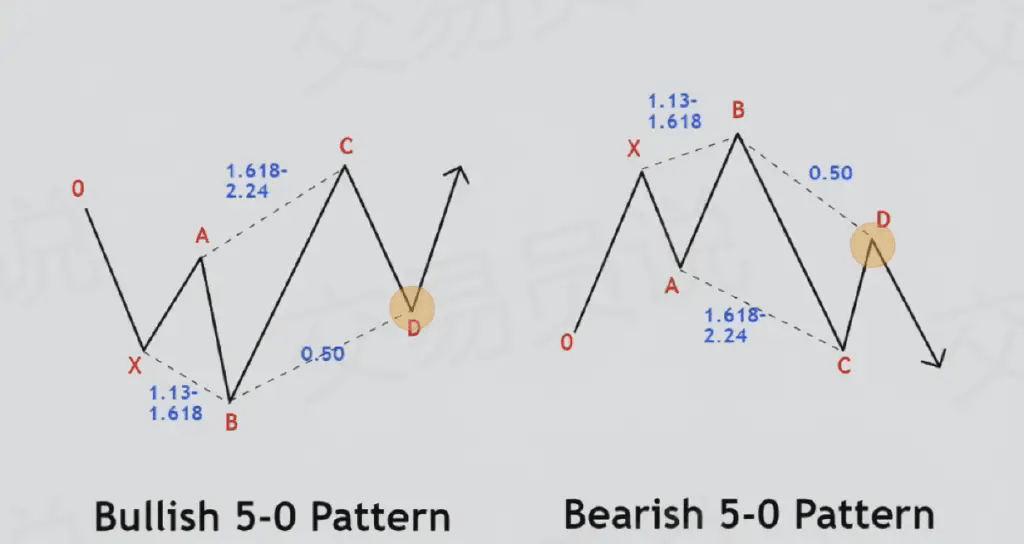
The 5-0 trading pattern is a harmonic trading model that technical analysts use to identify potential reversal points in the market. This pattern is characterized by its unique five-wave structure, providing a systematic approach to predicting and capturing market directional changes.
By combining Fibonacci retracement levels and extension levels, the 5-0 trading pattern can accurately identify potential reversal areas. This pattern is especially a high-probability trading tool for traders looking to enter on reversals.
Analysis of the Structure of the 5-0 Pattern
The 5-0 trading pattern is essentially a technical chart pattern composed of five consecutive price fluctuations (or 'legs'), labeled as XA, AB, BC, CD, and DE. This pattern typically occurs after a long-term trend, indicating that the original trend may reverse or pause.
Each wave follows specific Fibonacci retracement and extension ratios, making the 5-0 pattern a structurally rigorous and logically clear tool capable of revealing reversal areas that ordinary technical indicators may fail to detect.
The following is a detailed description of each price structure:
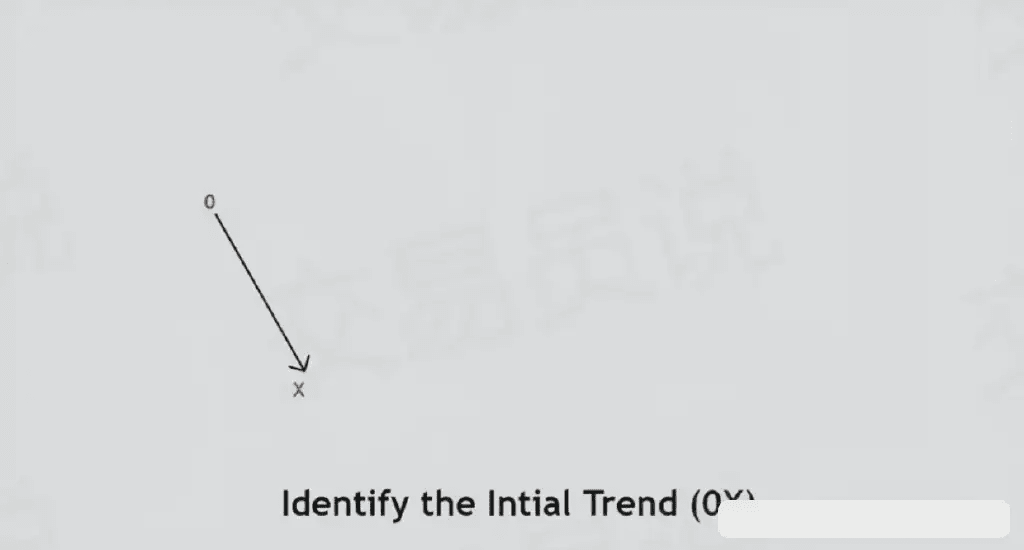
● 0X: The initial trend.
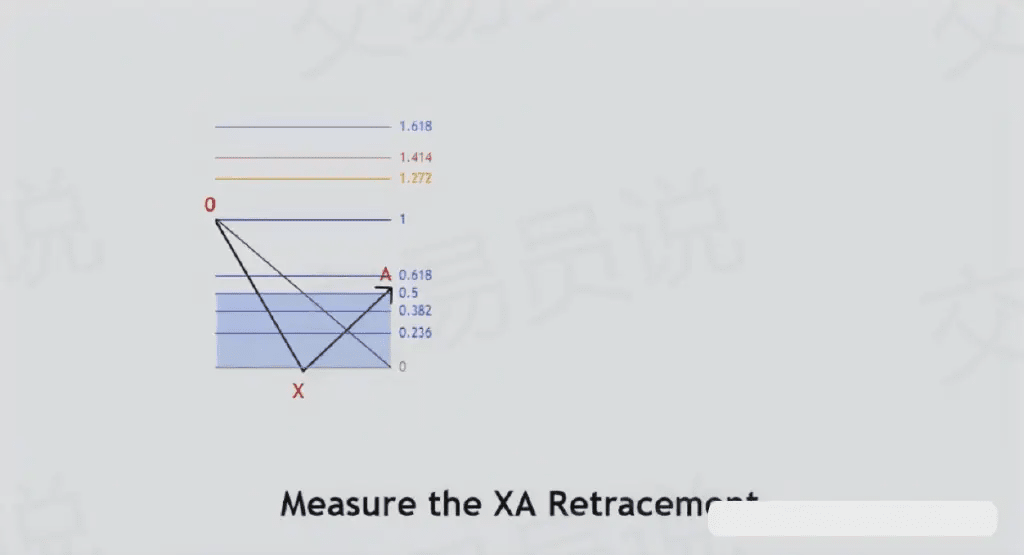
● XA: The retracement of wave 0X, typically around the 38.2% to 50% Fibonacci retracement level.
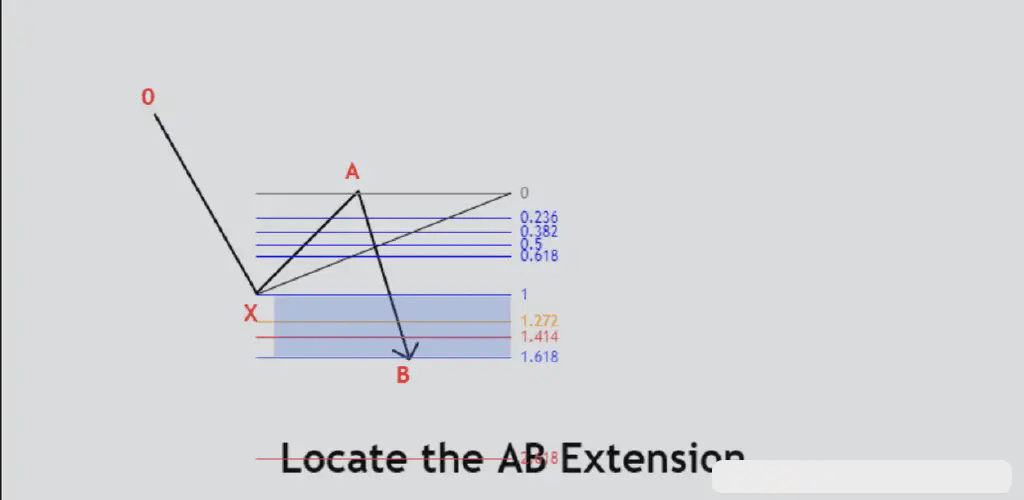
● AB: An extended wave that surpasses wave XA, typically reaching between 113% to 161.8% Fibonacci retracement levels of wave XA.
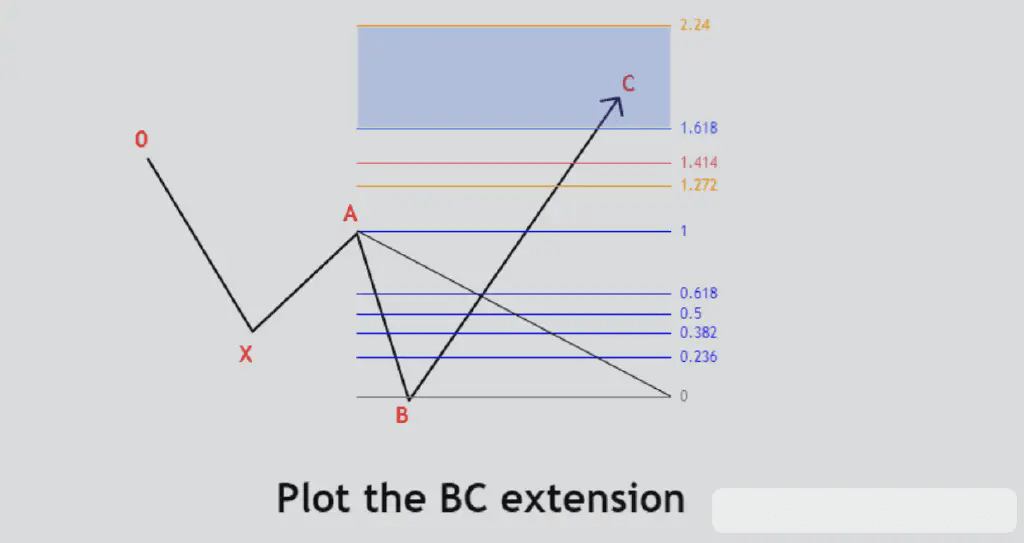
● BC: An extended wave that surpasses wave AB, usually reaching between 161.8% to 224% Fibonacci retracement levels of wave AB.
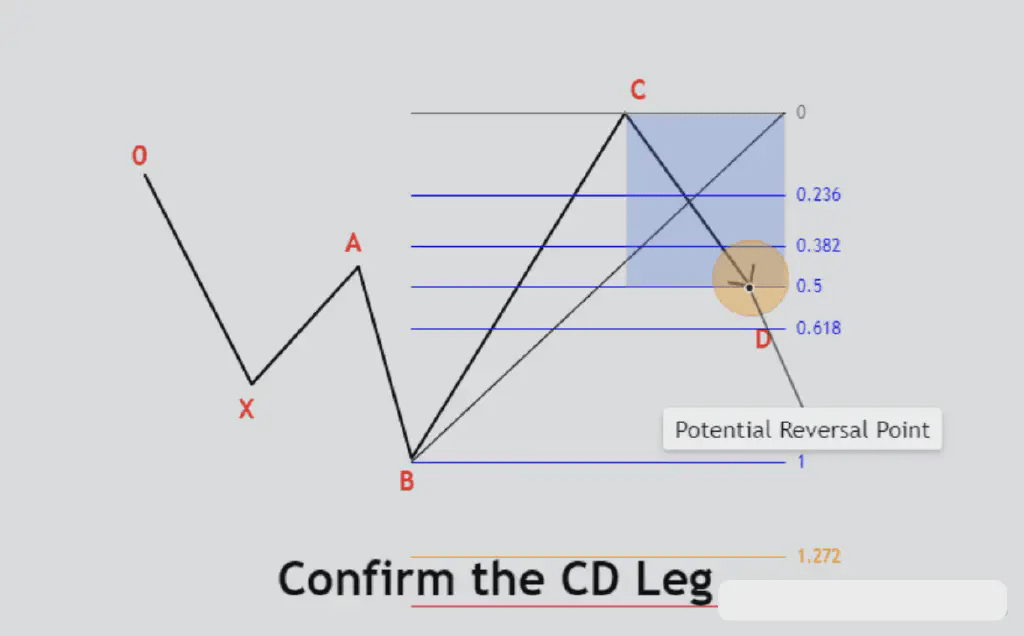
● CD: The final wave that completes the pattern, usually consistent with the 50% Fibonacci retracement level of wave BC.
How to draw the 5-0 trading pattern
Drawing a 5-0 trading pattern requires a systematic approach, whether manually or with automated tools.
When manually drawing the 5-0 trading pattern, traders must follow these steps:
1. Identify the initial trend (0X): First, observe a strong trend in the market, which will serve as the foundation for the entire pattern, forming the XA wave.
2. Measure the retracement of wave XA: Use the Fibonacci retracement tool to measure the retracement magnitude of wave XA, ensuring it falls within the 38.2% to 50% range of wave XA. This step confirms the first adjustment phase of the pattern.
3. Find the extension of wave AB: Identify wave AB, which must exceed the high/low of wave XA. Confirm the amplitude of wave AB exceeds 100% of wave XA using the Fibonacci extension tool; this is one of the key characteristics of the pattern.
4. Draw the extension of wave BC: Measure wave BC (the extended part of wave AB), which typically ranges from 161.8% to 224% of wave AB's retracement level.
5. Validate wave CD: Finally confirm whether wave CD has retraced approximately 50% of wave BC. This step will confirm the completion of the 5-0 pattern and mark potential reversal points.
For traders who prefer automated solutions, chart platforms like TradingView, MetaTrader, and ThinkorSwim provide harmonic pattern recognition indicators. These tools can automatically detect and mark 5-0 trading patterns on price charts, significantly simplifying the analysis process.
Simply enable the harmonic pattern tool and check the 5-0 trading pattern option in the settings; the system will automatically scan for potential pattern structures.
Automated tools are particularly beneficial for traders operating multiple varieties or across multiple time frames, saving time and improving efficiency.
How to trade using the 5-0 pattern
The key to trading the 5-0 pattern is to recognize the completion of segment DE and trade based on the expected reversal. Here are several steps to effectively trade this pattern:
1. Identify the pattern
The first step in trading the 5-0 pattern is to identify it on the price chart. Traders can manually draw this pattern according to the aforementioned steps, or use automated harmonic pattern recognition indicators provided by their trading platform (if available) to assist in identification.
Remember, confirming the validity of the pattern is crucial; ensure all wave segments (XA, AB, BC, CD, and DE) conform to specific Fibonacci ratios. The accuracy of identification will significantly impact the reliability of trades.
2. Wait for the pattern to complete
Patience is key when trading the 5-0 pattern. Traders must wait until segment DE reaches the expected Fibonacci retracement level before taking action.
The DE segment typically completes at the 50% retracement level of segment BC. If entering too early before the pattern is fully formed, one may suffer unnecessary losses due to price not reversing near the expected reversal point.
Monitoring price behavior near the expected completion area of segment DE helps to confirm the validity of the pattern and reduces the likelihood of false signals.
3. Determine the entry point
Once segment DE is completed, it marks a potential reversal area. Traders should enter as close to the completion point as possible.
For a bullish 5-0 pattern, where the price is expected to reverse upwards, traders can establish long positions.
Conversely, for bearish 5-0 patterns, where the price is expected to reverse downwards, it is recommended to establish short positions.
Combining other confirmation signals (such as candlestick formations: hammer, engulfing patterns, etc., or momentum indicators: RSI, MACD, etc.) can further enhance the reliability of trades.
4. Set stop-loss and target levels
Risk management is a crucial part of trading the 5-0 pattern. To prevent unexpected price fluctuations or pattern failures, traders should set stop-loss orders beyond the completion point of segment DE.
For bullish patterns, the stop-loss should be set slightly below the DE point; for bearish patterns, it should be set slightly above the DE point. This stop-loss setting allows for natural development of the trade while minimizing potential losses.
Setting profit target areas is also an important step in trading the 5-0 pattern. Appropriate target price levels can be determined using Fibonacci extension levels and significant support/resistance levels from previous periods.
Common targets include the 38.2%, 50%, or 61.8% Fibonacci extension levels of segment DE. Traders can also choose to take partial profits, reducing positions in stages at multiple target levels to lock in profits while allowing part of the position to continue holding to gain more profits as prices develop further in the expected direction.
Case Study
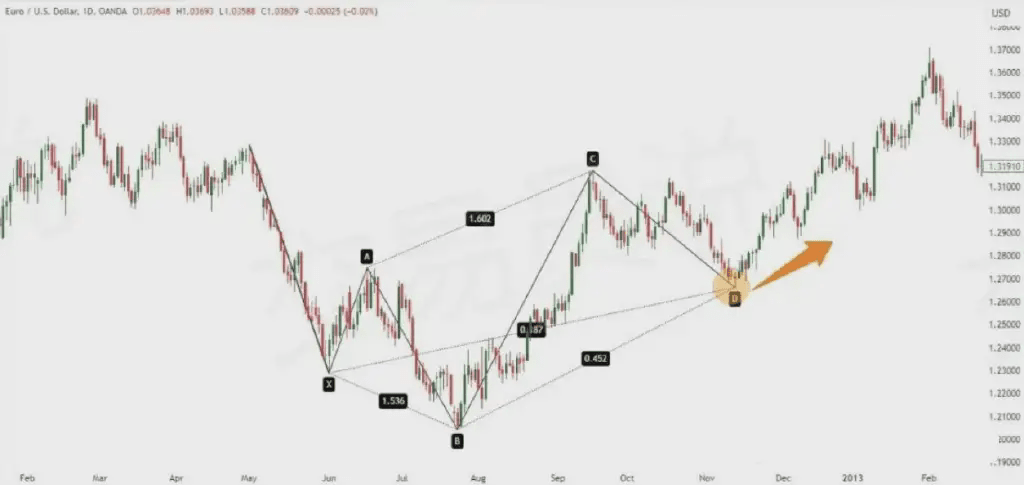
The structure of the 5-0 trading pattern is similar to an inverted head and shoulders pattern, with the second 'shoulder' extending over time. In the daily chart of EUR/USD below, we can draw a 5-0 pattern.
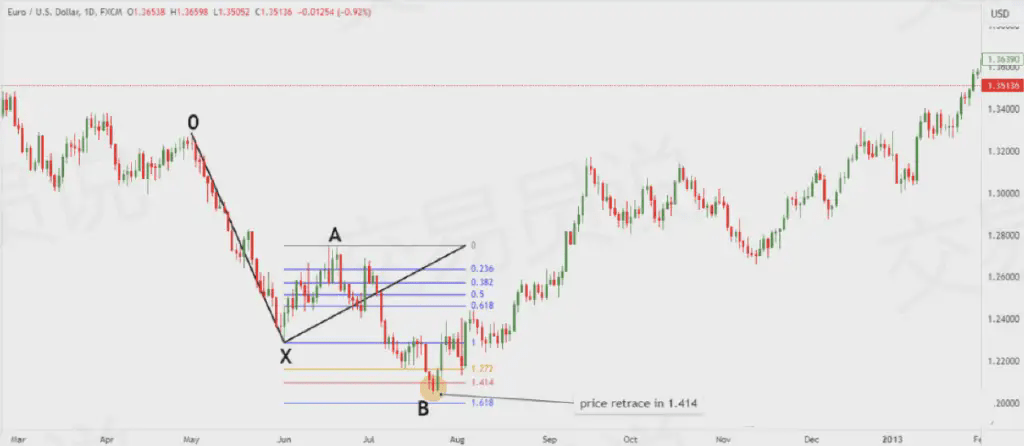
We drag the Fibonacci retracement tool from point X to point A. In this case, point B nearly touches the 1.618 level, complying with the rules of this pattern—it must fall between 1.13 and 1.618.
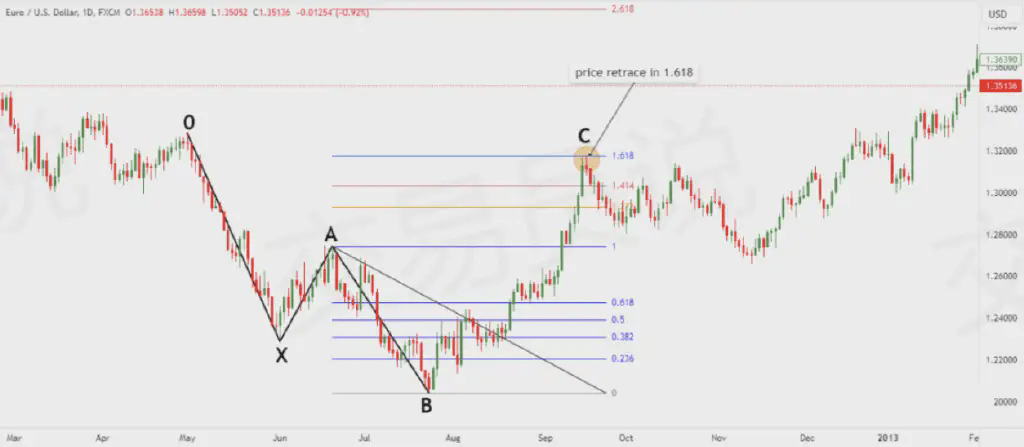
Next, reposition the Fibonacci tool from point A to point B. Point C should align with the 1.618 projection of the AB segment. In this case, point C successfully meets this condition, allowing the next step to proceed.
Next, move the Fibonacci tool from point B to point C to evaluate the trend of segment DE. Pay attention to whether the price retraces to the 0.50 retracement level and begins to move upwards. This indicates that segment DE may be forming, and it is also a signal that the pattern is about to complete.
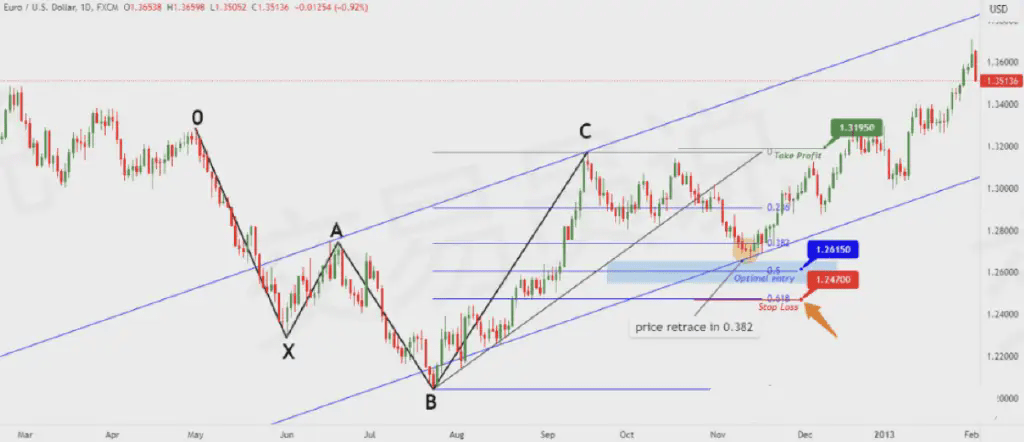
To further confirm, you can draw an ascending channel. The first line connects points A and C; the second line connects point B. If the price remains within this channel, it will further enhance the validity of the pattern and serve as an additional buy signal.
After confirming the pattern, develop a trading plan... In this case, the best buying area is approximately near 1.2615. The stop-loss should be set below the correction range, around 1.2470, which also corresponds to the 0.618 Fibonacci retracement level. To further confirm the entry signal, draw a descending trend line and wait for the price to break above it before executing the trade.
Finally, set profit targets to effectively manage trades. The first target can be set at 1.3110, aligned with the level of segment XA; the second target at 1.3195, which is the previous high of the pattern.
In the cryptocurrency world, super coins are not gambling; the cognitive game is a process of monetizing knowledge.
If your capital is limited (e.g., under 100k) but you desire to achieve several times the asset growth in a bull market,
1 The strategy for small capital is 'wait' not 'full': With 100k capital, as long as you seize 2-3 main coins with over 30% gains, the goal can be achieved. In a bull market, the biggest taboo is not missing opportunities, but getting trapped after going all-in. The truly skilled investors dare to stay flat and wait for opportunities; they are the sharp hunters in the market.
2 First ensure 'not losing', then pursue 'profit': In the cryptocurrency space, saying 'I feel this time it's different' comes at a high cost. One can only earn money within their cognitive range, so first use demo accounts to accumulate experience and refine mindset, and only enter the real market when sufficiently steady. It's clear that once there are significant losses in the real market, it may be difficult to recover.
3 Good news hides 'traps': On the day significant good news is announced, if the coin price has already surged, then the high opening the next day often represents a great selling point. The market makers are well-versed in using good news to cut retail investors, so one must remain vigilant.
4 Key points for operations before holidays: Based on data from the past 5 years, the probability of a price drop in the week before a holiday exceeds 70%. Therefore, either choose to reduce positions or simply go flat for the holiday; do not go against the high probability trend.
The key to medium to long-term investment is to 'leave bullets': Never invest all your funds at once. Sell in batches when prices rise; buy in batches when they fall. Stable cash flow is the guarantee for long-term survival in the cryptocurrency space.
6 The core of short-term investment lies in 'momentum': When trading volume suddenly expands sharply and the pattern breaks through resistance, act decisively; if there is a sideways contraction, it's better to miss the opportunity than to act rashly.
7 Opportunities hidden in sharp declines: A slow decline indicates no one is buying, and it may continue to drop; however, a sudden drop accompanied by volume often signals the last round of selling, with a rebound potentially just around the corner.
8 90% of people fail here: 'Just wait a bit longer and I will break even,' this is the most deceptive illusion in the cryptocurrency space. Stop-losses must be decisive and swift, while pursuing profits can be gradual. Once the principal is down 50%, a 100% profit is needed to break even; can you really manage that?
9 Short-term investment artifact: 15-minute KDJ indicator: Buy when a golden cross occurs, sell when a death cross occurs, while filtering out false signals with volume. This method is particularly suitable for investors who do not have time to monitor the market constantly.

