

XRP trades near $3.27 resistance, with a breakout potentially targeting $3.37, $3.51, and $3.55–$3.60.
Price is above 50 day and 200 day MAs, indicating bullish momentum despite lower address activity in early August.
Fibonacci levels show $3.1904 as immediate support, with deeper zones at $3.0159 and $2.9129 if selling pressure increases.
XRP is trading near a key price level that could determine its next move in the short term. According to analyst Ali, a break above $3.27 may lead toward $3.60. The digital asset has been consolidating after a strong rally, staying above several key technical supports.
This follows a sharp climb in mid July from around $2.40 to $3.65, supported by a golden cross between the 50 day and 200 day moving averages. While price momentum is intact, trading activity has eased, with active addresses dropping to approximately 43.4K in early August.
Technical Levels and Price Outlook
The recent correction has kept XRP within a descending parallel channel, marked by lower highs and lows. Fibonacci retracement levels from the $2.91 low to the $3.37 high show $3.27 as immediate resistance.
This level also aligns with the upper channel boundary. Support is at $3.19, corresponding to the 0.618 Fibonacci level. Below that, $3.13 and $3.08 are additional supports, with deeper zones at $3.01 and $2.91.
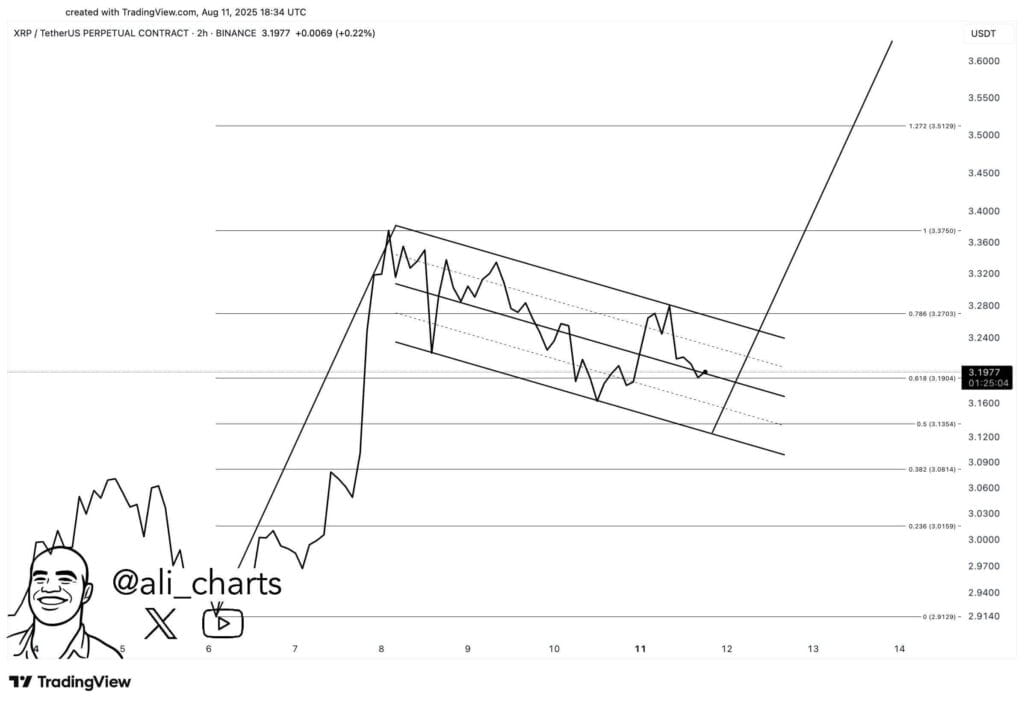 XRP/USDT Perpetual Contract 2-hour price chart, Source: Ali on X
The breakout target, if $3.27 is surpassed, includes $3.3750 and $3.5129, with a possible extension toward $3.55–$3.60. However, a drop under $3.16 could lead to $3.13 and $3.08, with $3.02–$2.92 as stronger downside areas.
Market Activity and Historical Price Trends
From mid February to late March, XRP declined from above $3.20 to the $2.10–$2.20 range. This period saw active addresses spike above 600K in early March, suggesting strong on-chain activity during the drop. The 50 day moving average stayed below the 200 day moving average then, confirming a bearish setup.
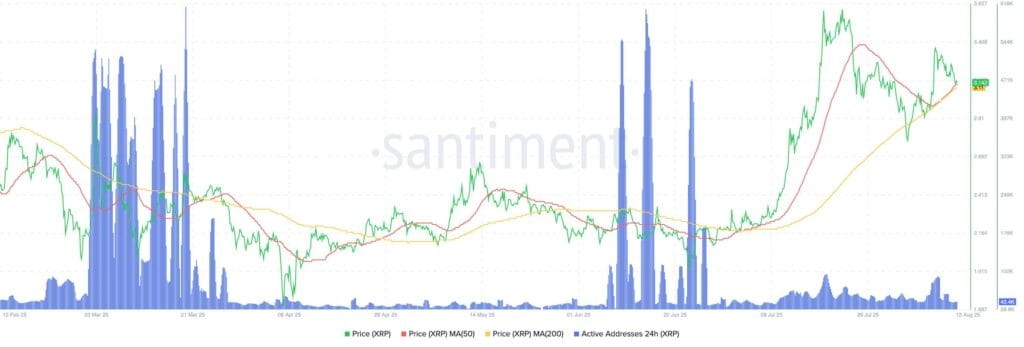 XRP price dynamics chart, Source: Santiment
Between April and early July, the price consolidated between $2.10 and $2.70. Address activity was subdued, with brief surges above 500K in mid June, showing intermittent activity without a sustained breakout.
Current Setup and Momentum Indicators
A breakout in mid July pushed XRP from $2.40 to $3.65, with the golden cross indicating stronger upward momentum. Active addresses reached around 250K during the rally but have since declined. The price is now holding near $3.14, close to the 50 day moving average at $3.11 and well above the 200 day average at $2.65.
The sustained position above both moving averages suggests strength, though lower address activity could limit short term volatility. Maintaining price above $3.10 could lead to a retest of higher resistance levels, with $3.27 as the key breakout point.
The post XRP Price Eyes $3.60 as Analyst Flags $3.27 Breakout Level appears on Crypto Front News. Visit our website to read more interesting articles about cryptocurrency, blockchain technology, and digital assets.
