When historical resistance becomes new support, Ethereum's journey to the stars truly begins.
1. The replay of historical scripts: Insights from 1440
After Ethereum reached a high of $1440 in 2018, that number seemed out of reach during the bear market. But the story after breaking through in 2020 is shocking: **1440 not only transformed into a strong support level but also became a springboard to the 4800 peak**. On-chain data reveals the truth:
- **Realized Price Distribution (URPD)** shows: The 1440 area once gathered a large amount of chips, and when it broke through in 2020, it fully rotated, and after the selling pressure was cleared, a 'value consensus bottom' naturally formed;
- **NUPL indicator** synchronously verifies: When the price retraces to 1440, the overall market is at the breakeven point (NUPL≈0), and holders' reluctance to sell forms a solid support wall.
**Historical patterns indicate the future: When 4800 is truly broken, it is likely to become the base for a new bull market.**
2. Breakthrough at 4800: A lightning battle in a 'vacuum zone'
Based on on-chain cost distribution and VPVR indicator analysis, the resistance faced by Ethereum shows a **pyramid structure**:
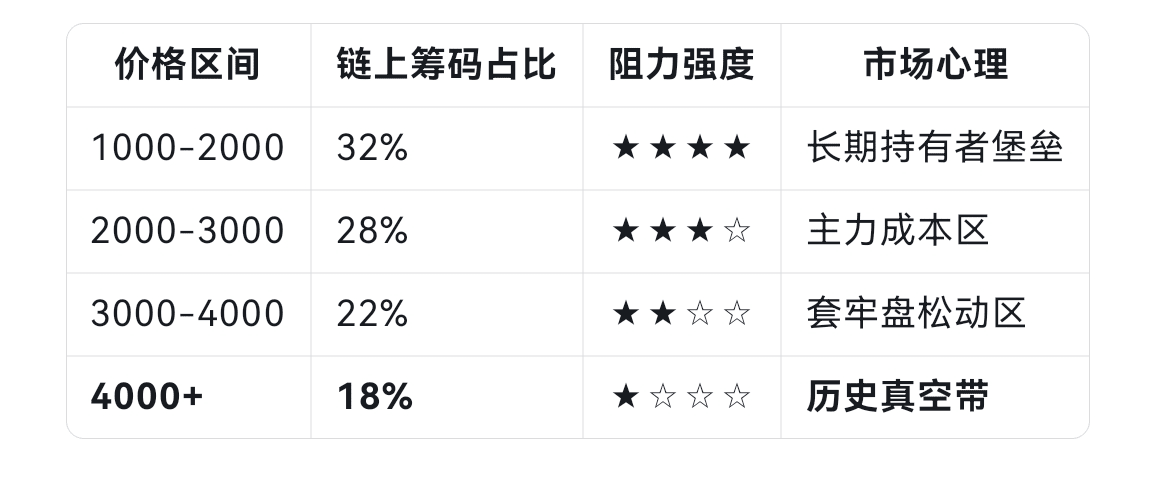
**Especially in the area above 4800, the historical turnover rate is extremely low, creating a natural 'resistance vacuum'**. This means:
1. **After confirming the breakthrough (three consecutive days closing > 4800), short covering + FOMO buying may drive prices to soar rapidly**;
2. The short-term target can directly aim for $5500-6000, with a potential increase of nearly 25%.
3. Three on-chain engines: Fueling the journey to ten thousand points
1. **Whales are hoarding in the shadows**
The proportion of addresses holding 1000+ ETH has increased from 39.2% at the beginning of 2024 to 41.5%, **accumulating an increase of over 3 million ETH** (approximately $12 billion). The movements of this 'smart money' often lead the market.
2. **Profit-taking pressure is in a safe zone**
Current aSOPR (Adjusted Spend Output Profit Ratio) value is 1.03, indicating an average profit of only 3%. History shows that when aSOPR is at 1.2, the risk of large-scale sell-offs is very low.
3. **The undervaluation window is still open**
MVRV-Z Score (Market Cap/Realized Value Z Score) currently reports 1.8, leaving 70% room before entering the bull market danger zone (>3.0). This indicator shows: **Even if it rises to $7500, Ethereum has not yet entered the bubble zone**.
4. The ultimate deduction: The four-part journey to ten thousand points

**Key catalyst scale**:
- ✅ **Ethereum ETF**: If approved, referring to Bitcoin ETF experience, **conservative increase of +50%** (target 7200);
- ✅ **Federal Reserve interest rate cuts**: During historical rate cut cycles, the average return on crypto assets is **+120%**;
- ⚠️ **Ecosystem staking unlock**: 26% staking ratio is a double-edged sword, monitoring Lido and other platforms is necessary.
5. Risk alert: The 'black swan' that disrupts the market
When these signals turn red, caution is needed for trend reversal:
1. **On-chain selling pressure**: Daily net inflow to exchanges > 150,000 ETH (current average 50,000);
2. **Leverage overheating**: Perpetual contract funding rate > 0.1%;
3. **Regulatory black swan**: The US SEC suddenly classifies ETH as a security.
Conclusion: The creators of new history
4800 is not just a number, but a milestone dividing two eras. When Ethereum truly crosses this peak, the solid chip base below (4200-4800) will support a value expedition towards ten thousand points. In this journey, **rational on-chain data monitoring is more reliable than fervent market sentiment**—after all, in the crypto world, real opportunities are always left for those who understand the 'value language' of blockchain.
When the K-line dances on the screen, only the on-chain data whispers: The game of support and resistance is essentially a resonance of human nature and value.