Price movement is not random. Every move leaves a mark - a pattern reflecting the ongoing tug-of-war between buyers and sellers. These patterns serve as an early warning system, helping you read the market's next potential move before it happens. Master these nine basic chart patterns and turn your technical analysis into an effective tool for trading. ---
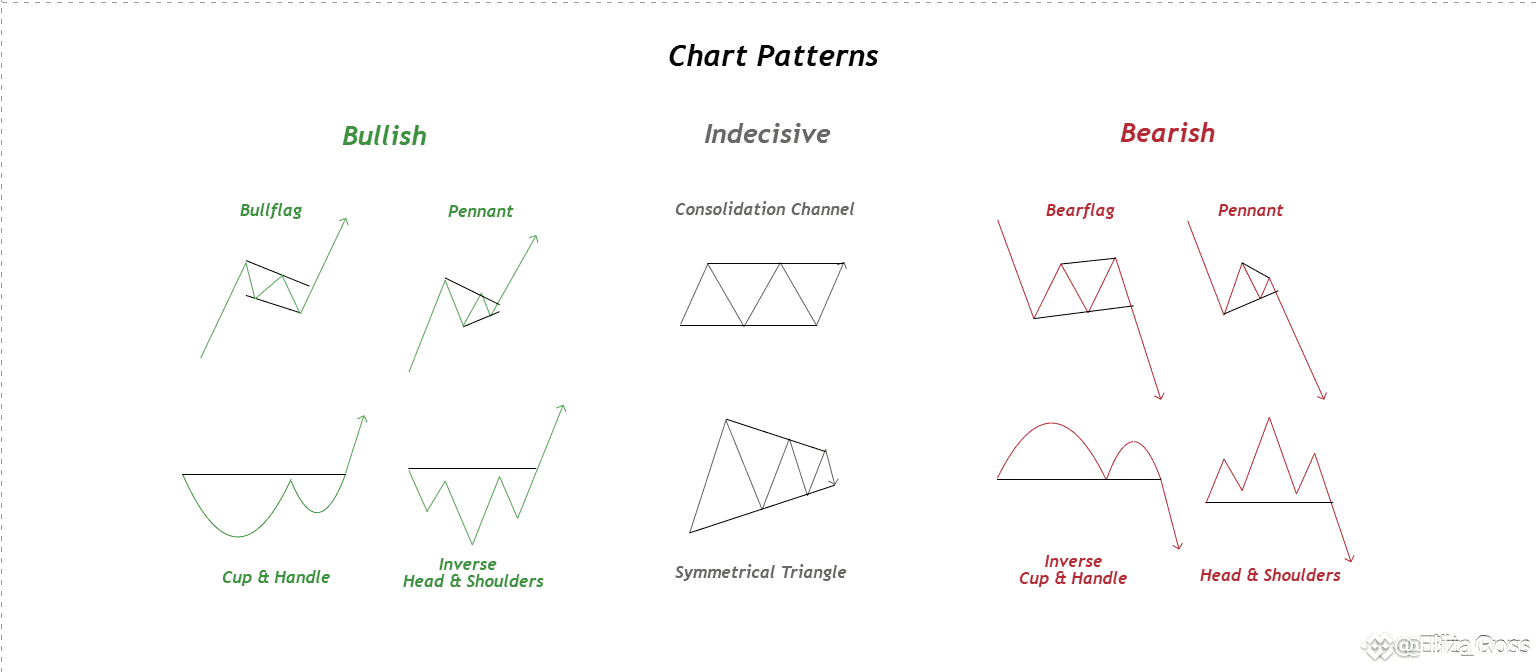
🔼 Bullish patterns - When the market is preparing to rise, these patterns indicate increased buying interest and the potential for continued upward movement.
1. Ascending flag A strong upward push followed by a brief slanting pullback. This short pause usually ends with the price resuming its upward trend.
2. Ascending pennant After a sharp rise, the price movement narrows to form a small triangle. Once it breaks out of this range, the bullish trend often accelerates.
3. Cup and handle A rounded base (the cup) followed by a shallow decline (the handle). Once the price breaks above the resistance level, it indicates strength and continuity.
4. Inverted head and shoulders Three declines, with the middle decline (the head) being the lowest. A breakout above the neckline confirms a reversal from a bearish trend to a bullish trend. ---
-- 🤝 Neutral patterns - When the market pauses, these patterns reflect indecision. A breakout can occur in either direction, and trading volume is often the deciding factor in determining the winning direction.
5. Horizontal channel (range) The price bounces between two horizontal lines. It is a sign that the market is calm and gathering energy for its next important movement.
6. Symmetrical triangle The price compresses within converging trendlines, forming a triangle. The direction of the breakout remains uncertain until trading volume begins to rise. --- 🔻 Bearish patterns - Warning signs of decline These patterns reveal increasing selling pressure and the likelihood of a downward movement.
7. Descending flag A sharp downward movement followed by a slight upward retracement. This movement often ends with another downward push.
8. Descending pennant Mirrors the bullish version but forms after a decline. A breakout below the triangle typically confirms the bearish trend.
9. Inverted cup and handle A rounded top followed by a slight pullback (the handle). A breakdown from the base often indicates a bearish trend. Bonus feature: Head and shoulders Three peaks, with the middle peak (the head) being the highest. A decline below the neckline confirms the shift from a bullish trend to a bearish trend. ---
-- 📈 Why these patterns change the game Chart patterns are like reading the market's mood. They provide a visual story of how traders react - whether hesitating, committing, or exhausting. When used with tools like volume and trend indicators, they can help you: Identify high-quality trading opportunities Set smarter entry and exit points Avoid chasing the market or selling out of panic ⚠️ Important reminder: Patterns are probabilities, not guarantees. Never gamble - always wait for confirmation through a breakout or breakdown before placing any trade. --- 💡 Pro tip: Save this guide and use it during chart analysis sessions. Over time, recognizing these patterns will become second nature - and you'll be ahead of traders who rely on their instincts.
Like and comment with 'Done'.