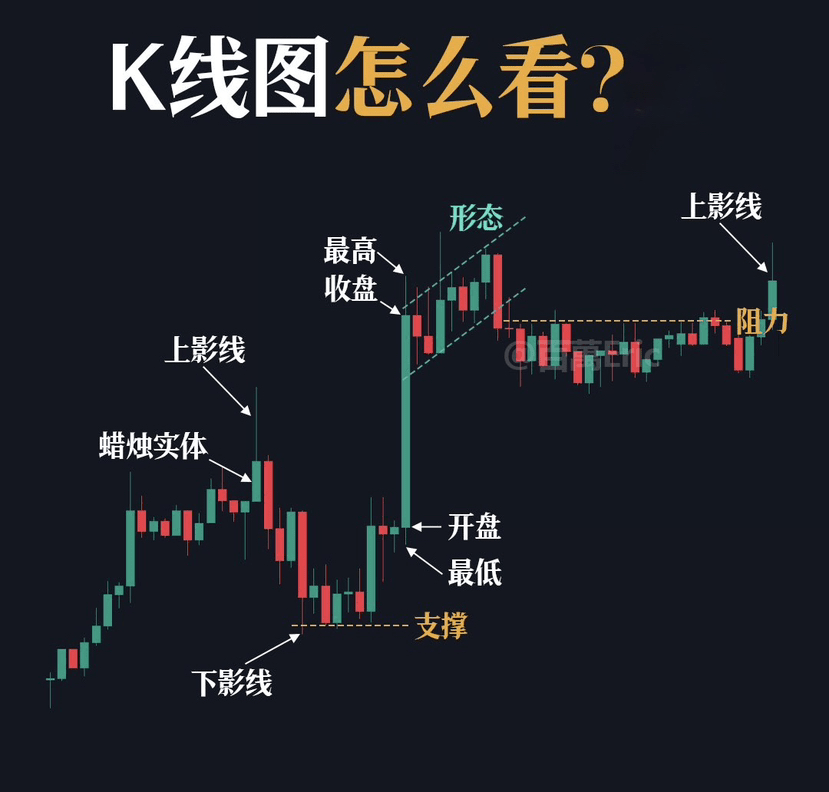
Step 1: Position determines the life and death of candlesticks (core logic)
✅ Candlesticks in an uptrend vs. candlesticks in a downtrend mean completely different things!
- 'Long Upper Shadow' in an uptrend: may be short-term profit-taking, but not necessarily a top, key to see if it breaks the previous low.
- 'Long Lower Shadow' in a downtrend: may be the main force protecting the market, but if there is no volume, it may be a bait trap.
- K-line at key support/resistance levels: reversal signals here (like hammer line, engulfing pattern) have high win rates!
⚠️ Common mistakes:
- Seeing a 'Doji' in a volatile market thinking it's a reversal, only to get cut back and forth!
- When breaking through previous highs, ignore trading volume, false breakout followed by crash!
---
Step 2: Pattern + Trading Volume = Strength Confirmation (details enhancement)
✅ True strong candlesticks must meet 3 conditions:
1. The body should be large (bullish candlestick body > 3%, bearish candlestick body > 2%).
2. Shadows should be short (upper and lower shadows do not exceed half of the body).
3. Trading volume cooperation (at least 3 times average volume during breakout, low volume rebound = baiting).
🔴 High-risk patterns (be careful not to get stuck!)
- 'Hanging Man' (high position long lower shadow): seems strong support, but in fact, the main force is unloading!
- 'Shooting Star' (high position long upper shadow): huge selling pressure, escape if the next day does not break the high!
- 'Pregnant Line' (volatile area): 90% are continuation signals, don't treat it as a reversal!
🟢 High win rate patterns (focus on this!)
- 'Morning Star' (end of a downtrend + large volume bullish candlestick) = Trend reversal!
- 'Engulfing Pattern' (key level + large body covers previous candlestick) = Breakthrough confirmation!
- 'Three Soldiers' (three consecutive large volume bullish candlesticks) = Main force strong rise!
---
⏳ Step 3: Cycle Resonance = Super Signal (dimensionality reduction strike)
✅ Real big opportunities must be multi-cycle resonance!
- Weekly trend upwards + Daily retest support + 4-hour volume breakout = Best buying point!
- Monthly dead cross + Daily breaks neck line + 1-hour rebound with no volume = Large-scale decline begins!
📌 Practical case (taking BTC as an example)
1. January 2023 bull market launch:
- Weekly MACD Golden Cross + Daily 'Morning Star' + 4-hour volume breakout at $17,000 = Surge signal!
2. March 2024 top signal:
- Monthly RSI overbought + Daily 'Double Top' + 1-hour no volume rebound = Major correction signal!
---
🎯 Ultimate summary: The 3-step rule of candlestick trading
1. First look at the position - is it a trend continuation or a key turning point?
2. Also look at the pattern + trading volume - is it a true breakout, or a trap?
3. Finally look at the cycle - smaller cycles obey larger cycles, avoid counter-trend operations!
💡 Suggest to bookmark, check against before each trade!
🚀 Follow me for wealth codes, I'll teach you more about cryptocurrency knowledge