What is Fibonacci retracement?
Fibonacci retracement is a tool used by technical analysts and traders to predict areas of interest on charts. They do this by using Fibonacci ratios as percentages. The Fibonacci retracement tool originates from a string of numbers discovered by the 13th-century mathematician Leonardo Fibonacci. This sequence, also known as the Fibonacci sequence, creates ratios from specific mathematical relationships between the numbers, which are then plotted on the charts. These ratios are:
0%
23.6%
38.2%
61.8%
78.6%
100%
Although technically speaking, 50% is not a Fibonacci ratio, some traders still believe this level holds significance as it represents the midpoint of the price range. Fibonacci ratios outside the 0-100% range can also be used, such as 161.8%, 261.8%, or 423.6%.
We will discuss how traders use these percentages, but the main point is that the levels they outline may relate to significant levels in the market. When plotted on a price chart, Fibonacci levels can be used to identify areas of interest such as support levels, resistance levels, retracement zones, entry points, exit points, and stop-loss levels.
How to calculate Fibonacci retracement
Since these percentages are the same in every Fibonacci retracement tool, you do not need to manually calculate anything. However, the way to obtain them is to start with the Fibonacci sequence.
Let's create a sequence of numbers that starts with 0 and 1, continually adding the sum of the previous two numbers to the current number. If this is done infinitely, we will obtain a string of numbers known as the 'Fibonacci sequence.'
0, 1, 1, 2, 3, 5, 8, 13, 21, 34, 55, 89, 144, 233, 377, 610, 987… and so on.
Of course, these numbers are not directly plotted on the price chart. However, the levels used in the Fibonacci retracement tool are derived from these numbers to some extent.
If you remove the first few numbers and divide a number by the number after it, you will get a ratio close to 0.618. For example, dividing 21 by 34 gives you 0.6176. If you divide a number by the second number to its right, you will get a ratio close to 0.382. For example, dividing 21 by 55 gives you 0.3818. All ratios in the Fibonacci retracement tool (except for 50%) are based on some calculations derived from this method.
Fibonacci sequence and the golden ratio
As mentioned above, the Fibonacci sequence was proposed by the mathematician Leonardo Fibonacci in the 13th century. The golden ratio (0.618 or 1.618) is a mathematical proportion derived from these numbers. Why is it such an important number?
The golden ratio describes the proportions of some astonishing phenomena in the universe, which can be found everywhere in nature. Think about atoms, stars, galaxy formations, shells, and even bees — from the smallest to the largest objects, they may all follow this ratio.
More importantly, for centuries, artists, engineers, and designers have used it to create visually pleasing works. From pyramids to the Mona Lisa, and even the Twitter logo, many famous works of art and design incorporate the golden ratio to some extent. It turns out that this ratio may also hold significant importance in the financial markets.
How to use Fibonacci retracement
Now that we understand what Fibonacci retracement tool is and how it works, let's consider its applications in the financial markets.
Typically, this tool is drawn between two significant price points, like high and low points. This range is then used as the basis for further analysis. Generally, this tool is used to plot levels within the range, but it can also provide insights into significant price levels outside the range.
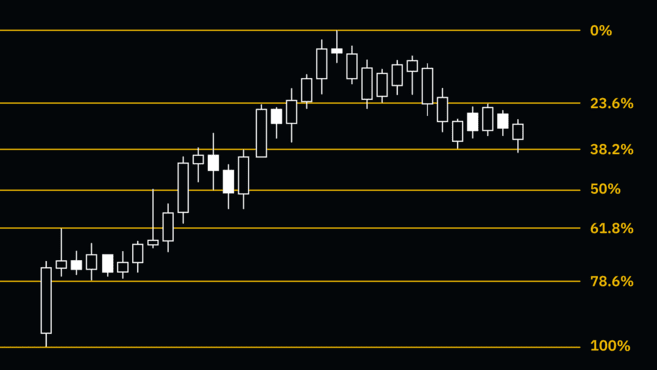
This range is usually drawn based on potential trends. Therefore, in an uptrend, the low point is 1 (or 100%), and the high point is 0 (0%). By plotting Fibonacci retracement lines on an uptrend, traders can understand potential support levels that may be tested when the market starts to pull back — hence the term 'retracement.'
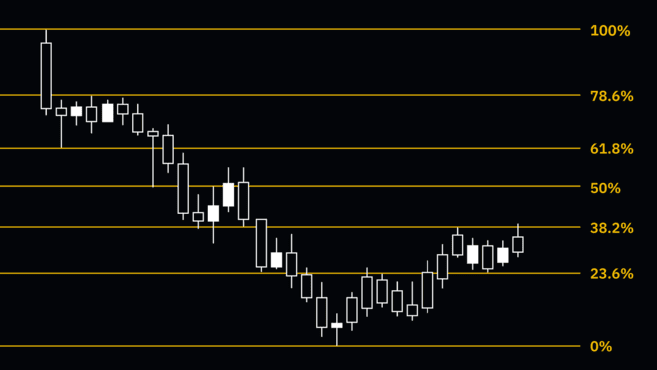
Conversely, in a downtrend, the low point is 0 (0%), and the high point is 1 (100%). Note that the price is in a downtrend. Therefore, in this case, a retracement refers to a movement starting from the bottom (a bounce). In this context, if the market begins to rise, the Fibonacci retracement tool may provide insights into potential resistance levels.
Want to start your cryptocurrency journey? Head to Binance now to buy Bitcoin!
What information can Fibonacci levels provide traders?
Traders can use Fibonacci levels to identify potential entry areas, price targets, or stop-loss points. This may vary significantly based on personal settings, strategies, and trading styles.
Some strategies may involve profiting within the range between two specific Fibonacci levels. For example, consider a retracement after an uptrend. Buying at the 38.2% retracement level and then selling at the 23.6% level may be an interesting strategy. Of course, this heavily depends on individual strategies and many other technical factors.
Fibonacci levels are often used in conjunction with Elliott Wave theory to find correlations between wave structures and areas of potential interest. This can be a powerful strategy to predict the extent of retracements in different fluctuations of a specific market structure.
Like other methods, the Fibonacci retracement tool works best when combined with other technical analysis indicators. A signal that is not originally a buy or sell signal may turn into one if confirmed by other indicators. Therefore, when the price reaches a specific Fibonacci level, it may reverse, or it may not. Thus, managing risk is crucial, and one must also consider the market environment and other factors.
Fibonacci extension
As mentioned above, Fibonacci levels can be used to assess retracement or bounce areas (the number 1 in the animation below). But beyond that, the Fibonacci sequence can also serve as a way to measure potential significant levels outside the current range. These are called extension levels (see number 2).
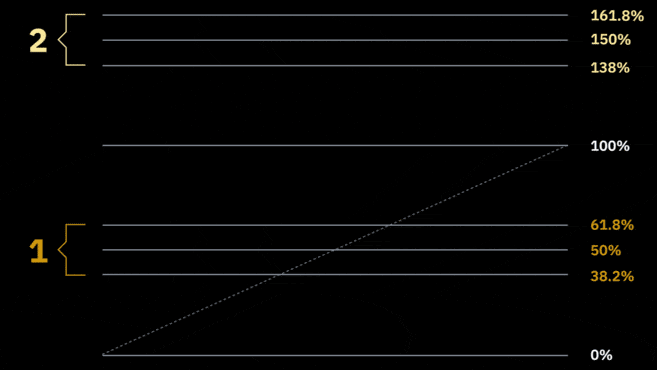
Fibonacci extension levels may be seen as potential trading targets. Each trader can choose a different extension level as a target (or multiple targets). The first few extension levels are 138.6%, 150%, and 161.8% — followed by 261.8% and 423.6%. Therefore, Fibonacci extension levels may indicate the endpoint of the next price movement.
Summary
The Fibonacci sequence is found everywhere in nature, and many traders believe it has relevance when charting the financial markets.
However, like all technical indicators, the relationship between price action, chart patterns, and indicators is not based on any scientific principles or physical laws. Therefore, the usefulness of the Fibonacci retracement tool may be related to the number of market participants paying attention to it. Thus, even though Fibonacci retracement levels may not necessarily relate to anything tangible, they can also serve as tools to attempt to predict areas of interest.