The Moving Average Convergence Divergence (MACD) is an oscillating-type indicator that is widely used by traders in technical analysis (TA). The MACD is a trend-following tool that uses moving averages to determine the trend of stocks, cryptocurrencies, or other tradable assets.
Developed by Gerald Appel in the late 1970s, the Moving Average Convergence Divergence (MACD) indicator records past price movements and thus belongs to the lagging category of indicators (providing trade signals based on past price behavior or data). The MACD can be used to gauge market trends and potential price trends and is used by many traders to identify potential buying and selling opportunities.
Before diving into the mechanics of MACD, it is essential to understand the concept of moving averages. A moving average (MA) simply represents the average of historical data over a predefined period. In the context of financial markets, moving averages are one of the most popular indicators in technical analysis (TA), and they can be divided into two different types: Simple Moving Average (SMA) and Exponential Moving Average (EMA). The SMA evenly weights all data inputs, while the EMA places more emphasis on the most recent data values (newer price points).
How MACD Works
The MACD indicator generates the main line (MACD line) by subtracting one Exponential Moving Average (EMA) from another, which is then used to calculate another Exponential Moving Average (EMA) representing the Signal Line.
Additionally, there is the MACD histogram, which is calculated based on the difference between the two lines. The histogram, along with the other two lines, fluctuates above and below the center line, which is also known as the zero line.
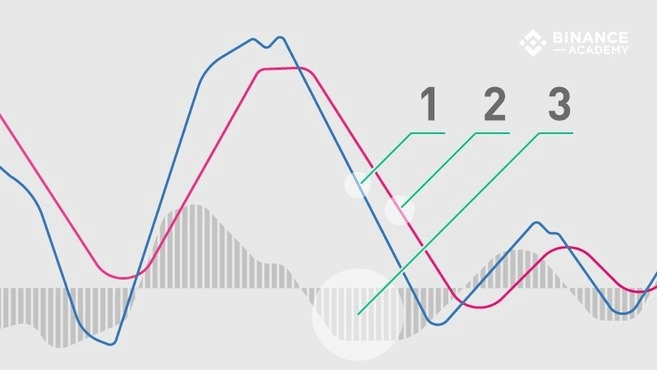
Thus, the MACD indicator consists of three elements moving around the zero line:
MACD Line (1): Helps determine upward or downward trends (market trend). It is calculated by subtracting two Exponential Moving Averages (EMAs).
Signal Line (2): EMA of the MACD line (EMA with a period of 9). The combined analysis of the Signal Line and the MACD line helps identify potential reversals or entry and exit points.
Histogram (3): A graphical representation of the divergence and convergence between the MACD line and the Signal Line. In other words, it is calculated based on the difference between the two lines.
MACD Line
In general, the Exponential Moving Average is calculated based on the asset's closing prices, and the periods used to calculate the two EMAs are typically set to 12 periods (faster) and 26 periods (slower). Periods can be configured in different ways (minutes, hours, days, weeks, months), but this article will focus on daily standard settings. Nevertheless, the MACD indicator can still be customized according to different trading strategies.
Assuming the time frame is set to the standard range, the MACD line is calculated by subtracting the 26-day EMA from the 12-day EMA.
MACD Line = 12-day EMA - 26-day EMA
As mentioned, the MACD line oscillates above and below the zero line, which signals the center line crossover, indicating when the relative positions of the 12-day and 26-day EMAs change.
Signal Line
By default, the Signal Line is calculated from the 9-day EMA of the main line, thus providing further analysis of its previous trends.
Signal Line = 9-day Exponential Moving Average of the MACD Line
While they are not always accurate, when the MACD line and the signal line cross, this event is often seen as a signal of trend reversal, especially when it happens at the top of the MACD chart (far above or far below the zero line).
MACD Histogram
The histogram is a visual record of the relative movement between the MACD line and the Signal Line. It is calculated by subtracting the two:
MACD Histogram = MACD Line - Signal Line
However, the histogram is not an additional third moving line but consists of bar charts, making it visually easier to read and interpret. Note that the histogram bars are not related to the trading volume of the asset.
MACD Settings
As mentioned, the default settings of the MACD are based on the EMA for 12, 26, and 9 periods—that is, MACD (12, 26, 9). However, some technical analysts and chart experts may use more sensitive period indicators, such as MACD (5, 35, 5) or longer time frame periods that are frequently used in traditional financial markets, such as weekly or monthly charts.
It is worth noting that due to the extreme volatility of the cryptocurrency market, increasing the sensitivity of the MACD indicator may produce more false signals and misleading information, thus creating risks.
How to Read MACD Charts
As the name suggests, the Moving Average Convergence Divergence (MACD) indicator focuses on the relationship between moving averages, and the relationship between the two lines can be described as convergence or divergence. When the two lines come close together, it is called convergence; when they separate, it is divergence.
Nonetheless, the signals related to the MACD indicator are associated with what are known as crossover points, which occur when the MACD line crosses above or below the center line (center line crossover) or above or below the signal line (signal line crossover).
Keep in mind that center line and signal line crossovers can occur multiple times, generating many false and misleading signals—especially in volatile assets like cryptocurrencies. Therefore, the MACD indicator should not be relied upon solely.
Center Line Crossover
When the MACD line moves in the area above or below the center line, a center line crossover occurs. When it crosses the center line upwards, it is a positive MACD, indicating that the 12-day EMA average is greater than the 26-day. Conversely, when the MACD line crosses the center line downwards, it is a negative MACD, indicating that the 26-day EMA average is higher than the 12-day. In other words, a positive MACD indicates a stronger upward momentum, while a negative one indicates a stronger downward momentum.
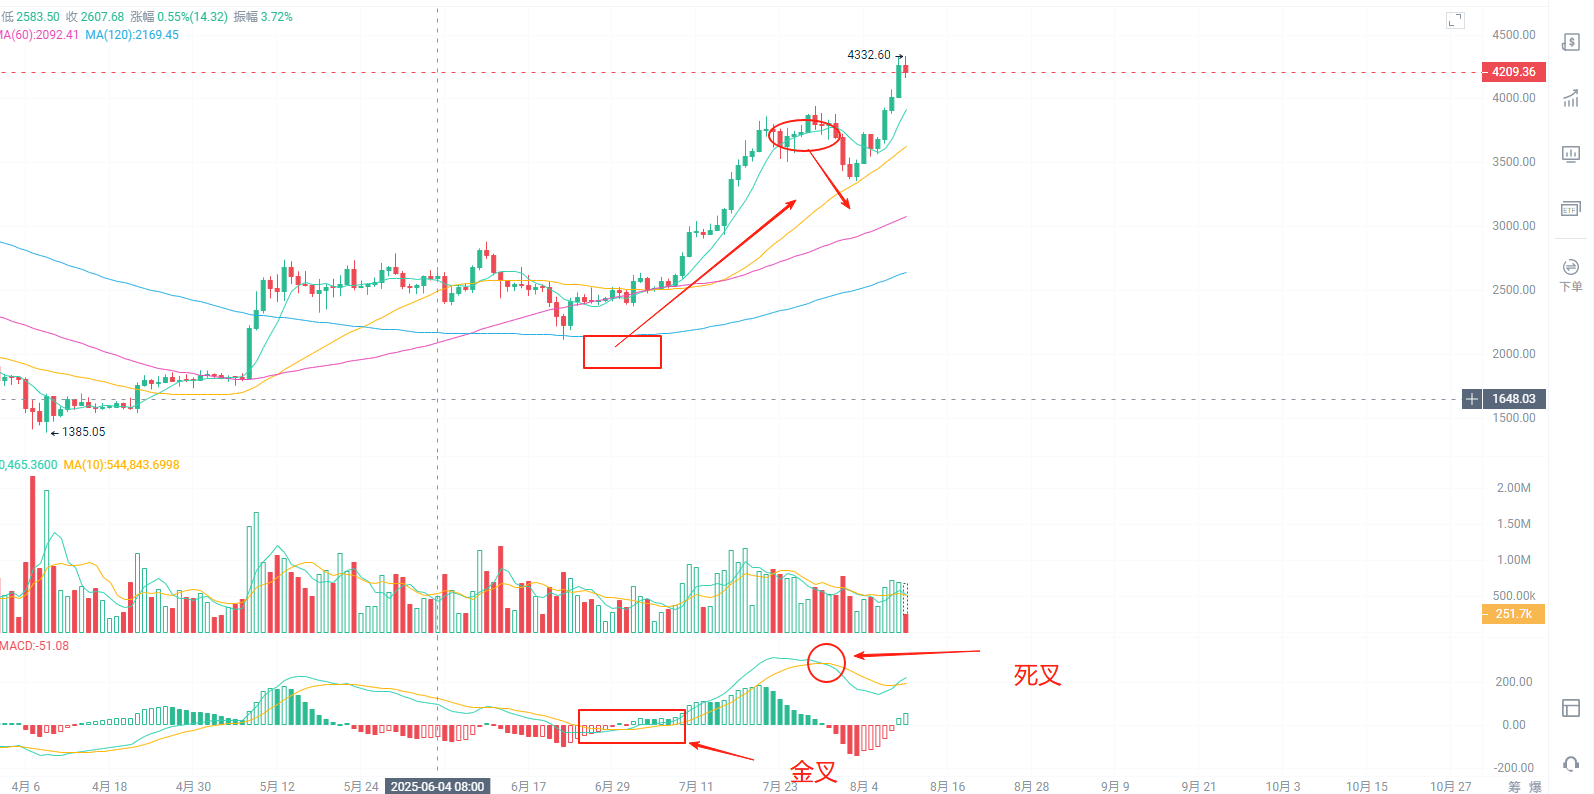
Signal Line Crossover
When the MACD line crosses above the signal line, traders typically consider this as a potential buying opportunity (entry point). Conversely, when the MACD line crosses below the signal line, traders tend to see it as a selling opportunity (exit point).
While signal line crossover signals can be helpful, they are not always reliable. We also need to consider their position on the chart to minimize risk. For example, if the signal line crossover generates a buy signal, but the MACD line is below the center line (negative), the market condition may still be considered bearish. Conversely, if the signal line crossover generates a sell signal but the MACD line is above the center line (positive), the market condition may still be bullish. In this case, following the sell signal from the crossover could pose more risk (greater downward trend).
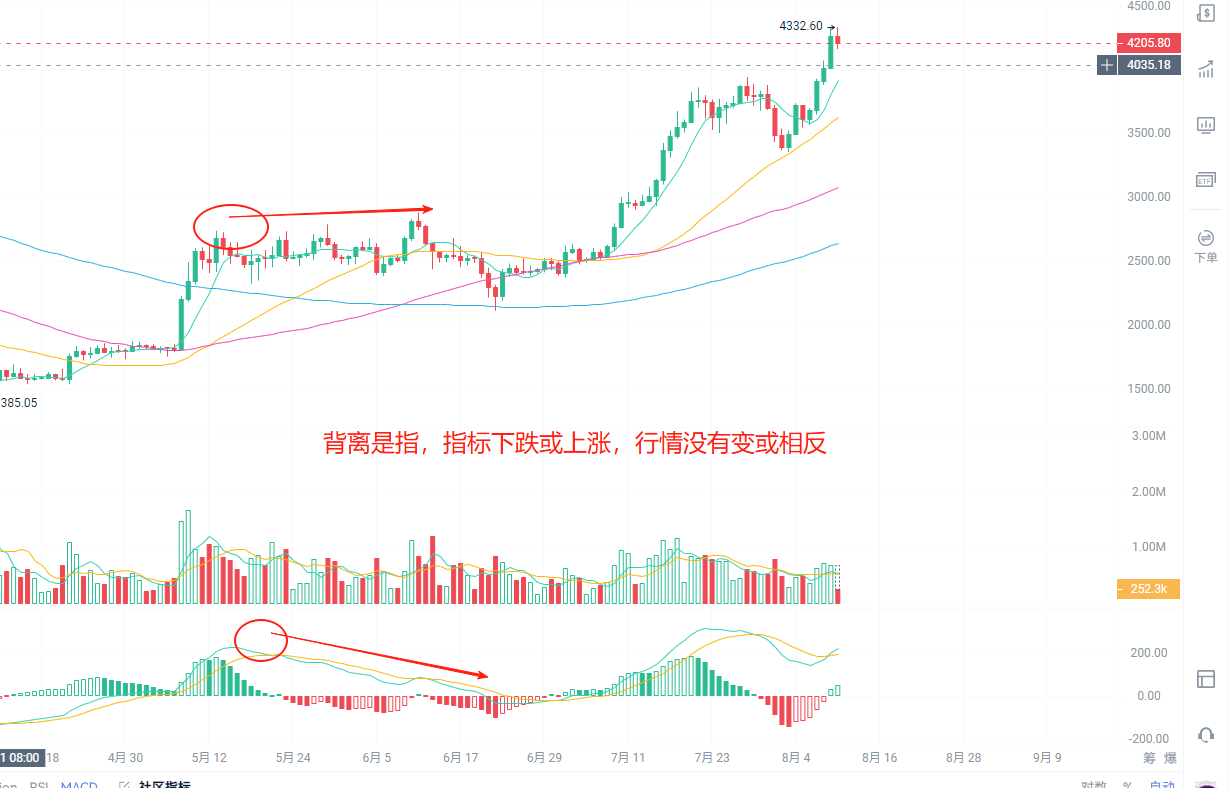
MACD and Price Divergence
In addition to the center line and signal line crossover, signals can also be discovered through the differences between the MACD chart and the asset price.
For example, if the price of a cryptocurrency is rising, but the MACD shows a lower high, it is considered a top divergence, which indicates that despite the price increase, the upward momentum (buying pressure) is not as strong as before. Top divergences are often interpreted as selling opportunities because they tend to occur before price reversals.
Conversely, if the MACD line forms two rising lows that correspond with two falling lows of the asset price, it is considered a bottom divergence, indicating that despite the price decline, buying pressure is stronger. A bottom divergence appearing before a price change may suggest that a short-term bottom reversal (from a downtrend to an uptrend) will occur.
Summary
In technical analysis (TA), the Moving Average Convergence Divergence indicator is one of the most useful tools. Not only is it relatively easy to use, but it is also very effective in determining market trends and market momentum.
However, like most technical indicators, the MACD is not always accurate and can provide numerous false and misleading signals, especially when analyzing assets with poor stability or when the market is weak and range-bound. Therefore, many traders also use the MACD alongside other indicators, such as the RSI, to further reduce risk and confirm signals.