Relative Strength Index
Technical analysis (TA) is essentially a practice of examining past market events to attempt to predict future trends and price behaviors. From traditional markets to cryptocurrency markets, most traders rely on specialized tools to perform technical analysis, with the RSI being one of them.
The Relative Strength Index (RSI) is a technical analysis (TA) indicator that emerged in the late 1970s, allowing traders to assess a stock's performance over a specific period. Essentially, it is a momentum oscillator used to measure the magnitude and speed (rate) of price changes. The RSI can be a very useful tool, depending on the trader's individual circumstances and trading style.
The Relative Strength Index was created by J. Welles Wilder in 1978. He first introduced this indicator and other TA indicators, such as Parabolic SAR, Average True Range (ATR), and Average Directional Index (ADX), in his book (New Concepts in Technical Trading Systems).
Wilder worked as a mechanical engineer and real estate developer before becoming a technical analyst. He began trading stocks around 1972 but was not very successful. A few years later, Wilder compiled his trading research and experiences into mathematical formulas and indicators, which were later adopted by many traders around the world. The book was published in just six months, and despite being a product of the 1970s, it is still referenced by many chart experts and traders today.
How does the RSI indicator work?
By default, the RSI measures the price changes of an asset over 14 periods (14 days for daily charts, 14 hours for hourly charts, and so on). The calculation formula for this indicator divides the average gain by the average loss over that time period, and then plots the data on a scale from 0 to 100.
As mentioned earlier, the RSI is a momentum indicator used to measure the speed of price (or data) changes and is part of technical trading tools. When a stock's momentum increases and its price rises, it indicates that the stock is being actively bought in the market. If momentum increases and the price falls, it indicates that selling pressure is increasing.
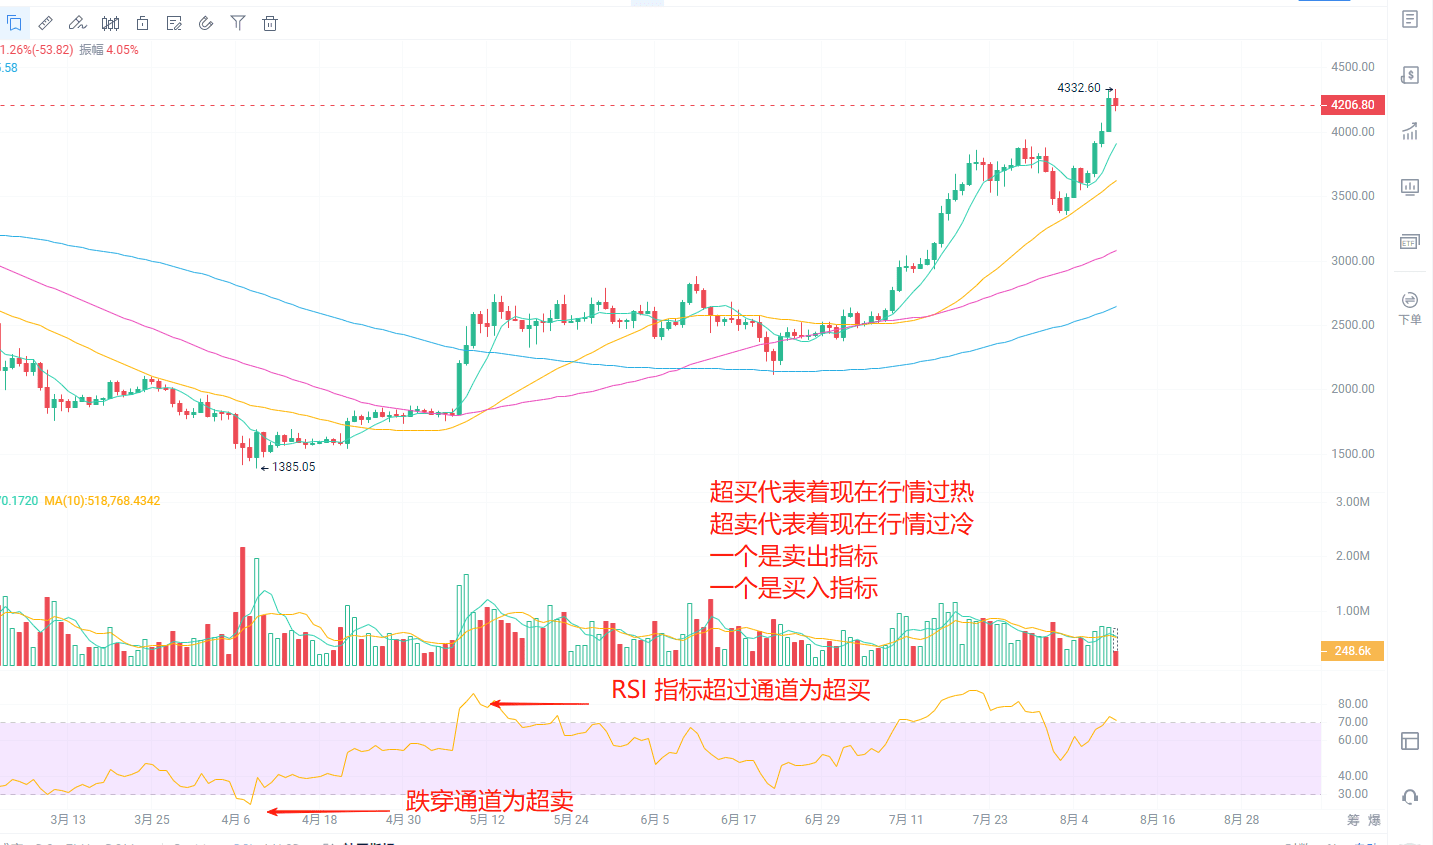
The RSI is also an oscillator that makes it easier for traders to identify whether the market is overbought or oversold. This indicator measures the asset's price over 14 periods and evaluates it on a scale of 0 to 100. If an asset's RSI score is 30 or below, it suggests that its price may be near a low (oversold), while a score above 70 indicates that the asset's price may be near a high during that period (overbought).
Although the default setting for RSI is 14 periods, traders can choose to modify the number of periods to increase sensitivity (reduce periods) or decrease sensitivity (increase periods). Therefore, a 7-day RSI is more sensitive to price fluctuations than a 21-day RSI. Additionally, when choosing a short-term trading approach, the RSI indicator can be adjusted to consider 20 and 80 as oversold and overbought levels (instead of 30 and 70), so the indicator is less likely to provide false signals.
Indicator settings, set the RSI indicator to 0, 14, 0. Beginners can just look at one line.
How to use RSI based on divergence
In addition to determining potential oversold and overbought market conditions through RSI scores (30 and 70), traders can also use the RSI to attempt to predict trend reversals or find support and resistance levels. This method is based on so-called bullish and bearish divergence.
Bullish divergence refers to the opposite direction of price and RSI score changes. In other words, the RSI score rises while the low price increases, leading to lower lows. This is called 'bullish' divergence, indicating that despite the downward trend in price, buying power is still increasing.
Conversely, bearish divergence indicates that despite rising prices, market momentum is declining. As a result, the RSI score decreases, with higher prices occurring while the asset price rises, leading to higher highs.
However, note that RSI divergence is not as reliable in strong market trends. That is, during a strong downtrend, multiple bullish divergences may occur before prices actually bottom out. For this reason, RSI divergence is more suitable for markets with lower volatility (sideways movements or subtle trends).
Summary
Several important factors must be considered when using the Relative Strength Index, such as the background, scores (30 and 70), and bullish/bearish divergence. However, always keep in mind that there is no 100% effective technical indicator, especially when used alone. Therefore, traders should consider using the RSI indicator in conjunction with other indicators to avoid generating false signals.