What is the Bollinger Bands indicator?
The Bollinger Bands indicator (BB) was created by financial analyst and trader John Bollinger in the early 1980s. The Bollinger Bands indicator is widely used as a (financial analysis) tool in the field of technical analysis (TA), essentially serving as an oscillator that indicates high and low volatility in the market, as well as overbought or oversold conditions.
The main principle of the Bollinger Bands indicator is to emphasize how prices fluctuate around an average value. More specifically, the indicator consists of the upper band, lower band, and the middle moving average (also known as the middle line). The two horizontal bands react to market price behavior, expanding (moving away from the middle line) when volatility is high and contracting (moving towards the middle line) when volatility is low.
The standard Bollinger Bands formula sets the middle line as the 20-day Simple Moving Average (SMA), while the upper and lower bands are calculated based on market volatility related to the SMA (known as standard deviation). The standard configuration of the Bollinger Bands indicator is as follows:
Middle line = 20-day Moving Average (SMA)
Upper band = 20-day SMA + (20-day standard deviation x 2)
Lower band = 20-day SMA - (20-day standard deviation x 2)
Standard Bollinger Bands use a 20-day period, setting the upper and lower bands two standard deviations away from the middle line (x2). This is done to ensure that at least 85% of price data will fluctuate between these two bands, but the settings can also be adjusted according to different needs and trading strategies.
How to apply the Bollinger Bands indicator in trading?
Although the Bollinger Bands indicator is widely used in traditional financial markets, they can also be applied in cryptocurrency trading systems. There are various methods to use and analyze the Bollinger Bands indicator, but one should not treat Bollinger Bands as an independent tool or view them as indicators of buy/sell opportunities. Instead, Bollinger Bands should be used in conjunction with other technical analysis indicators.
With this in mind, let's consider how people can interpret the data provided by the Bollinger Bands indicator.
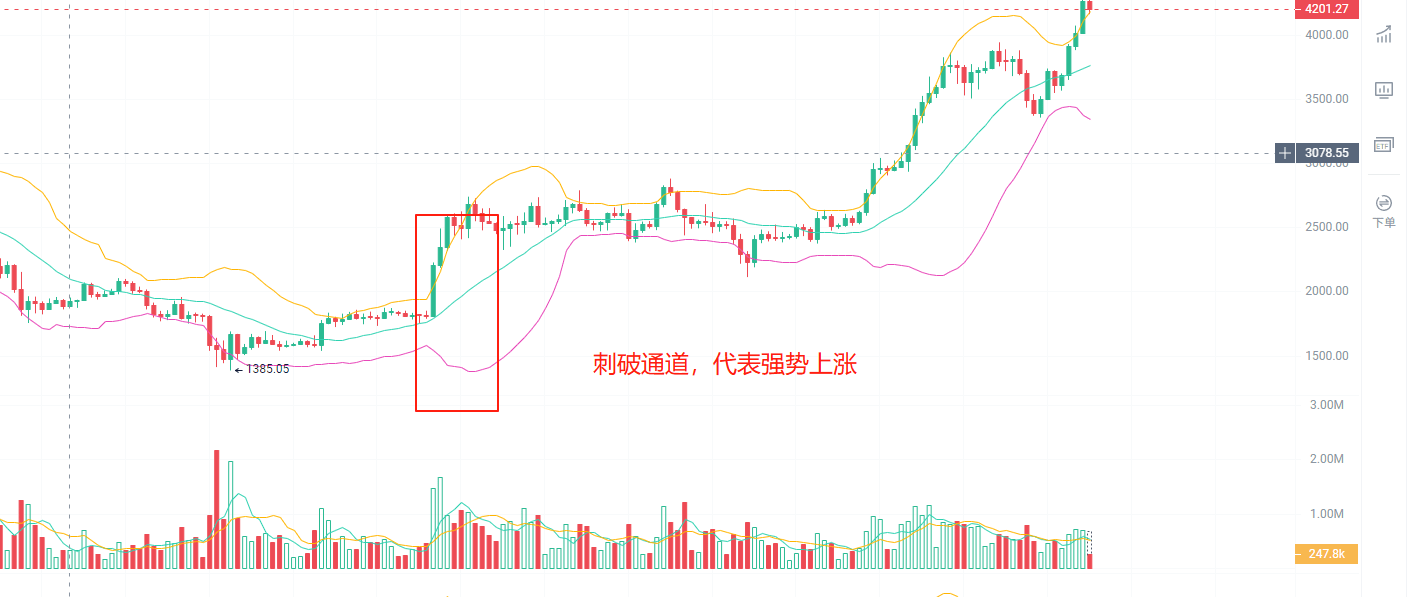
If the price is above the moving average and exceeds the upper band of the Bollinger Bands, it can be safely assumed that the market is currently overextended (overbought). On the other hand, if the price repeatedly touches the upper band, it may indicate a significant level of resistance.
Conversely, if the price of certain assets significantly decreases and repeatedly exceeds or touches the lower band, the market may be in an oversold state or have reached a strong support level.
Therefore, traders can use Bollinger Bands (as well as other TA indicators) to set their selling or buying targets, and similarly, they can gain an overall understanding of overbought and oversold conditions in the market.
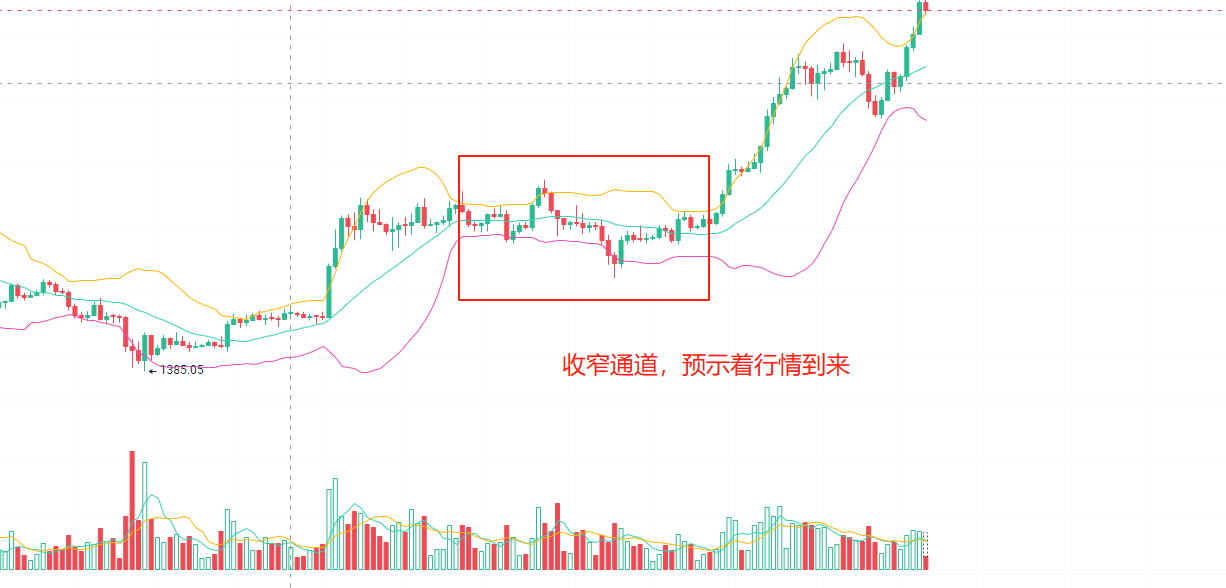
Furthermore, when attempting to predict moments of high and low price volatility, the expansion and contraction of the Bollinger Bands indicator may be useful. The bands will move away from the middle line during periods of high asset price volatility (expansion) or move towards the middle line during periods of weaker price movements (contraction).
Thus, the Bollinger Bands indicator is more suitable as a tool for analyzing market volatility and trying to predict upcoming trends in short-term trading. Some traders believe that when the bands are excessively expanded, the current market may be approaching a consolidation period or about to reach a trend reversal. Similarly, when the bands are too narrow, traders think that a significant movement will occur in the market.
When the market price moves sideways, the Bollinger Bands tend to narrow towards the middle Simple Moving Average. Generally (but not always), low volatility and small deviation levels occur before large explosive movements, and this phenomenon occurs once volatility picks up.
Bollinger Bands Indicator vs Keltner Channel
Unlike the Bollinger Bands based on SMA and standard deviation, the modern version of the Keltner Channel (KC) indicator uses the Average True Range (ATR) to set the channel width above and below the 20-day Exponential Moving Average (EMA). Therefore, the formula for the Keltner Channel is roughly as follows:
Middle line = 20-day Exponential Moving Average (EMA)
Upper band = 20-day EMA + (10-day ATR x 2)
Lower band = 20-day EMA - (10-day ATR x 2)
Typically, Keltner Channels present tighter bands than Bollinger Bands. Therefore, it may be more suitable for Keltner Channels to indicate trend reversals and overbought/oversold market conditions in a clearer manner. Additionally, Keltner Channel indicators generally provide earlier overbought/oversold signals than Bollinger Bands.
On the other hand, Bollinger Bands can better represent market volatility because their expansion and contraction movements are larger and clearer compared to Keltner Channels. Additionally, by using standard deviation, the Bollinger Bands indicator is less likely to provide false signals, as its width makes it difficult for the (upper and lower bands) to be crossed.
Bollinger Bands are more popular compared to Keltner Channels. However, both indicators are good—especially for short-term trading setups—and both can be used in combination to provide more reliable (market) signals.