The cryptocurrency market is flashing bullish signals as Ethereum (ETH) reclaims the $3,900 mark for the first time since late 2024. This 6% daily jump has sparked a broader rally, lifting several major altcoins — including Sui (SUI).
SUI has turned green with an impressive 9% daily jump, extending its monthly gains to over 31%. However, its current chart structure reveals a familiar price behavior, which may offer clues about its next move.
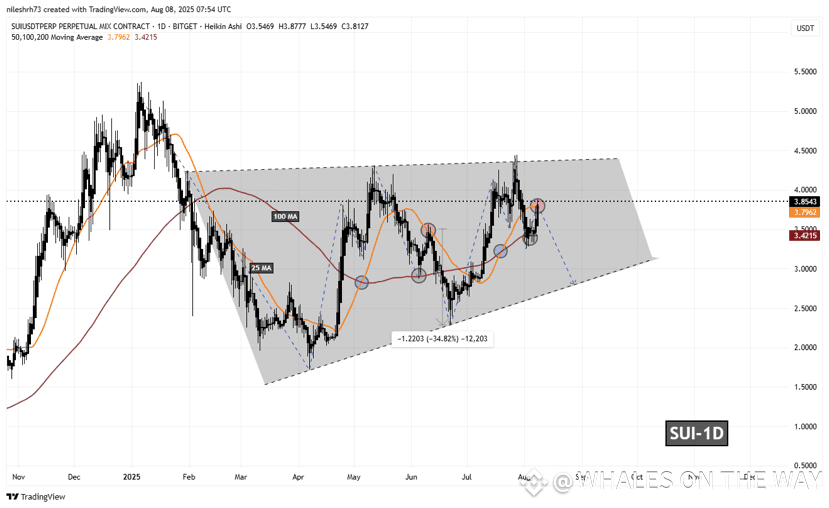
Sui (SUI) Daily Chart/Coinsprobe (Source: Tradingview)
Fast forward to the present, and SUI seems to be repeating the same structure.
It recently bounced off the 100-day MA and has now reclaimed the 25-day MA — once again marked by a red circle, placing the asset in a similar position to its last breakdown.
What’s Next for $SUI
SUI?
If this fractal pattern continues to unfold, a breakdown below the 25-day MA support at $3.79 would act as confirmation. This would open the door for a drop toward the 100-day MA at $3.42, and possibly a further decline toward the wedge’s lower trendline near $2.80 — representing a 26% drop from current levels.
However, if bulls manage to hold the 25-day MA, this would invalidate the bearish scenario and signal strength. In this case, SUI could climb higher, potentially retesting the upper resistance of the wedge around $4.40.
