Bitcoin is currently accumulating in the thin 'liquidity void' between the $110,000 and $116,000 marks, as the market waits for new demand to establish a more solid price level.
According to Glassnode's report on August 6, after reaching a new historical peak above $123,000 in mid-July, the BTC price adjusted to $113,000. This move has caused many investors to recently fall into a loss state, while also creating a supply cluster with a cost basis above $116,000.
The bottom of this cluster has repeatedly supported the recovery until July 31 when BTC broke down and entered the liquidity void. Historically, such thin liquidity zones often become accumulation areas when buyers begin to enter positions with the expectation of getting a good price.
Glassnode has compared URPD (entity-based price distribution) data between July 31 and August 4 to assess bottom-fishing activity.
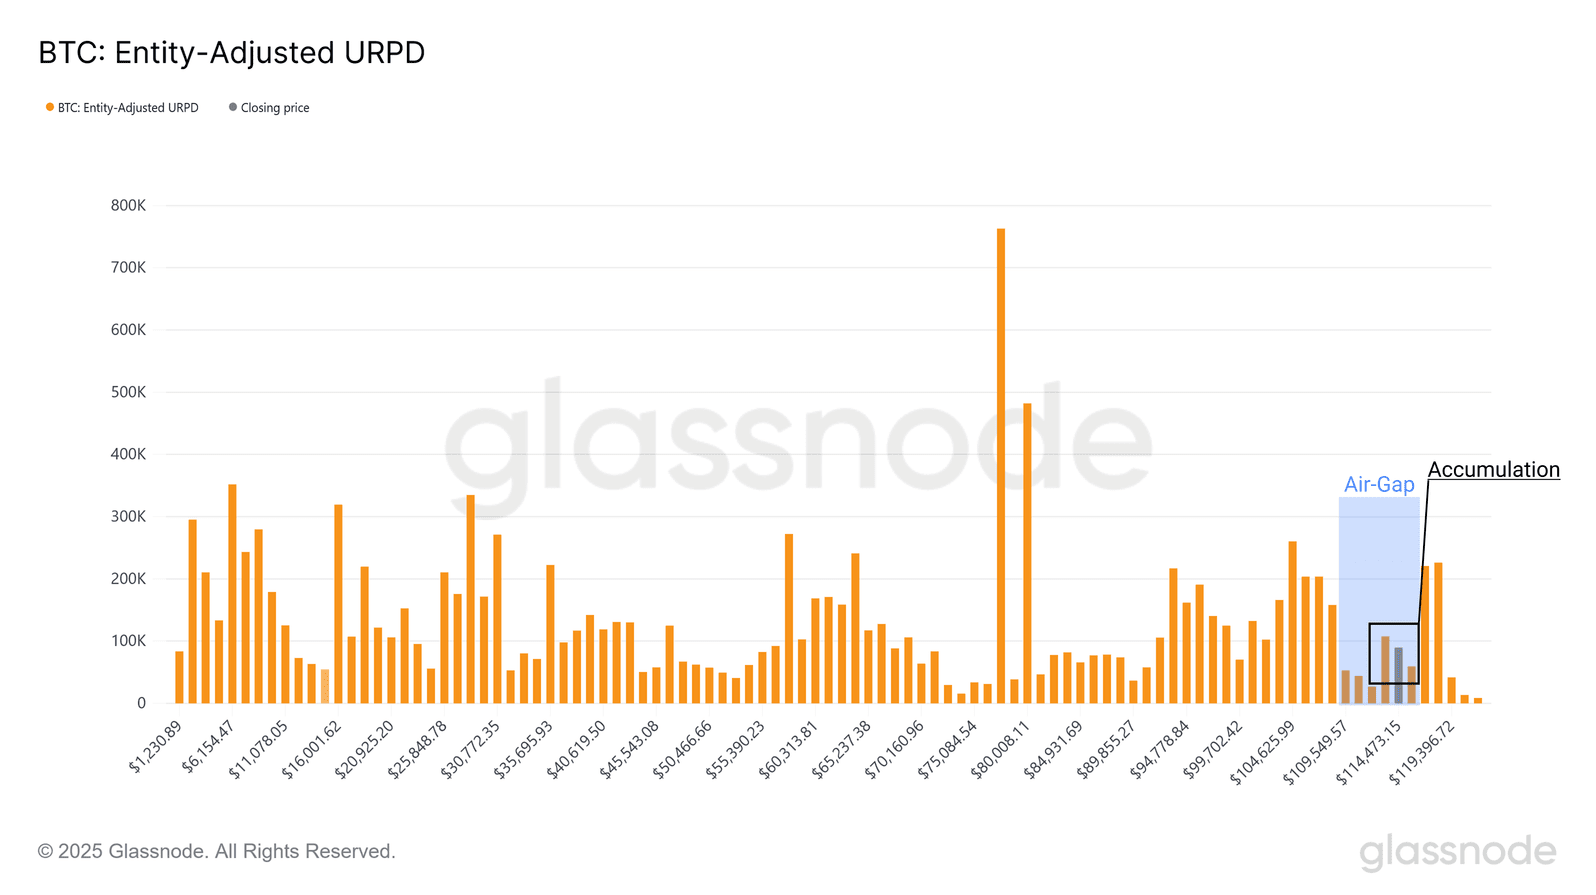
Source: Glassnode
After a rebound from the $112,000 area, investors bought about 120,000 BTC, helping the spot price rise back above $114,000, indicating that opportunistic demand is still active. However, the $110,000–$116,000 range still lacks clear accumulated supply. The accumulation period in this area could form a springboard for the next increase.
New resistance and indicators are not yet overheated
Currently, the upward momentum has not surpassed the cost basis of investors holding BTC for about 1 week to 1 month — with a notable resistance level near $116,900. If this level is successfully broken, it could signal that demand is regaining control. Conversely, failure here could pull BTC back to test the old peak around $110,000.
According to Glassnode, the BTC price remains in the 'warm' zone but has not entered an overheated state. The price is also above the average cost basis of short-term holders (STH) at $106,000 — a level that often marks the boundary between bullish and bearish phases in short-term market cycles.
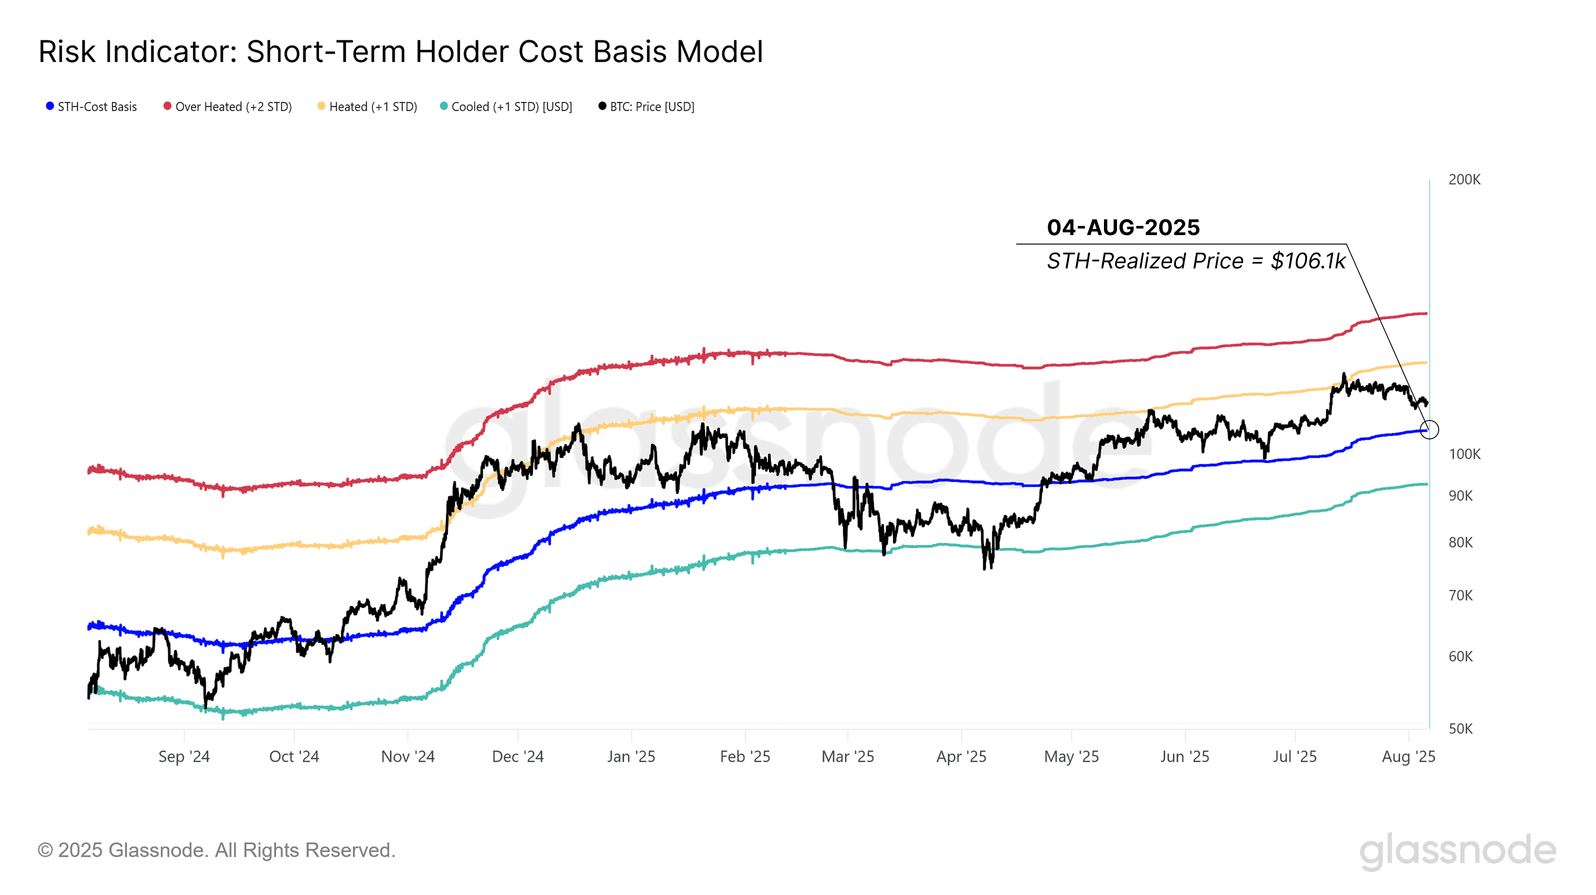
Source: Glassnode
The amount of BTC held by short-term investors that is profitable has decreased from 100% to 70% during the correction phase, corresponding to the average level in previous up cycles. The trading volume that is profitable for this group has also dropped to 45%, below the neutral threshold — indicating that the market is balanced, with neither side having a clear advantage.
ETF and derivatives market
On August 5, U.S. spot Bitcoin ETF funds recorded capital outflows of about 1,500 BTC — the largest net outflow since April 2025. Although such capital withdrawals often occur in the short term, monitoring extended trends is very important.
In the derivatives market, the funding rate of perpetual contracts has dropped below 0.1% — a neutral zone, reflecting that speculative appetite is cooling and short-term bullish sentiment is becoming more cautious.
Overall, Bitcoin is currently still stuck in the price range of $110,000–$116,000, accumulating supply and waiting for demand strong enough to surpass $116,900 and reaffirm the uptrend.
