Bitcoin (BTC) has been quiet in the narrow price range of $112,000 to $115,720 for the past few days — a clear sign of the fierce struggle between the bulls and bears as the market stands at a crossroads.
According to Bitfinex experts, the current weakening of BTC, along with the decline of most altcoins, reflects a 'cooling' in speculative appetite. They assess that the cryptocurrency market is entering an accumulation phase, but also emphasize that macro factors or new capital flows from cryptocurrency ETF funds could act as catalysts, determining the next direction.
While the short-term price action of Bitcoin has not yet convinced a segment of analysts, Tom Lee — co-founder of Fundstrat and president of BitMine — maintains a positive outlook. In a response on the Coin Stories podcast, Lee predicts that BTC could break out strongly and reach the $200,000 mark, even $250,000 before the year ends.
Will Bitcoin have enough momentum to break out of the current price range? And if that happens, will altcoins follow BTC's upward movement? Let's explore the technical charts of the top 10 cryptocurrencies to search for clues for the next move of the market.
Technical analysis of BTC
On Tuesday, BTC bounced from the 50-day simple moving average (SMA) at $112,619, indicating that the bulls are actively defending this level.
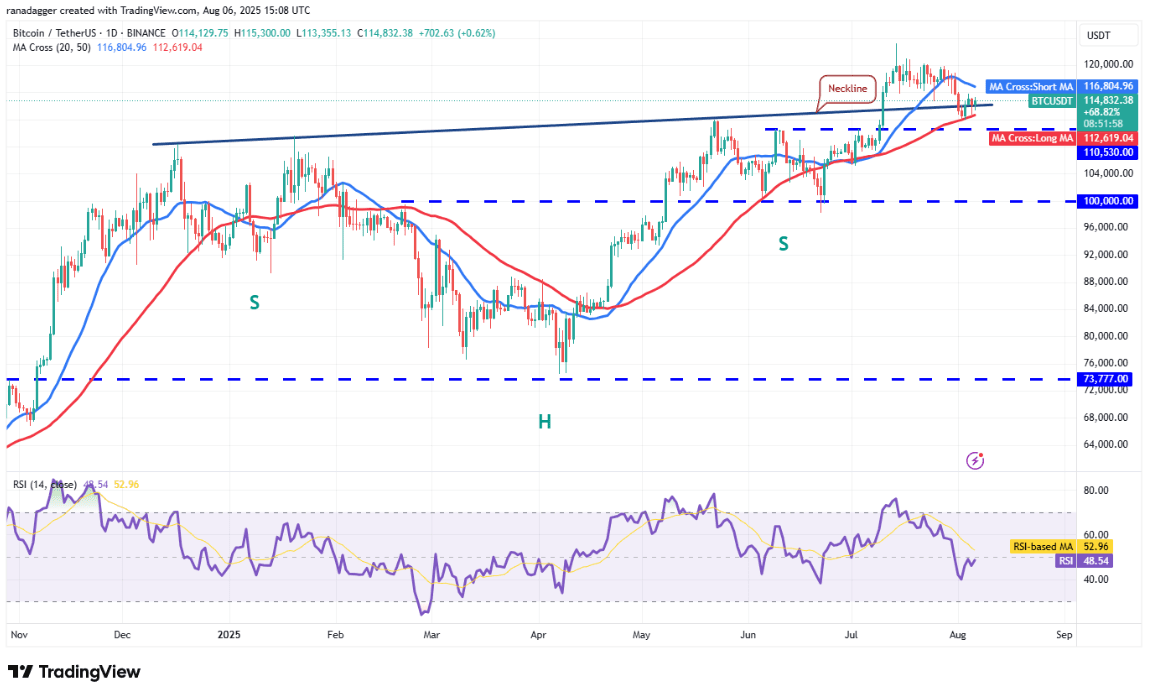
This recovery is expected to face selling pressure at the 20-day SMA ($116,804), which is trending downward. If this happens, the BTC/USDT pair may continue to be squeezed between the two moving averages for some time.
The bulls will gain an advantage if they push the price above and maintain it above the 20-day SMA. If successful, the currency pair could head towards the upper resistance area at $120,000, and then to the historical peak of $123,218.
Conversely, if breaking below the 50-day SMA, BTC could drop to $105,000, and then to $100,000. Although there is support at the $110,530 level, it is unlikely that this level will hold.
Technical analysis of ETH
On Monday, buyers pushed the price of Ether (ETH) above the 20-day SMA ($3,675) but failed to surpass the resistance level of $3,745.
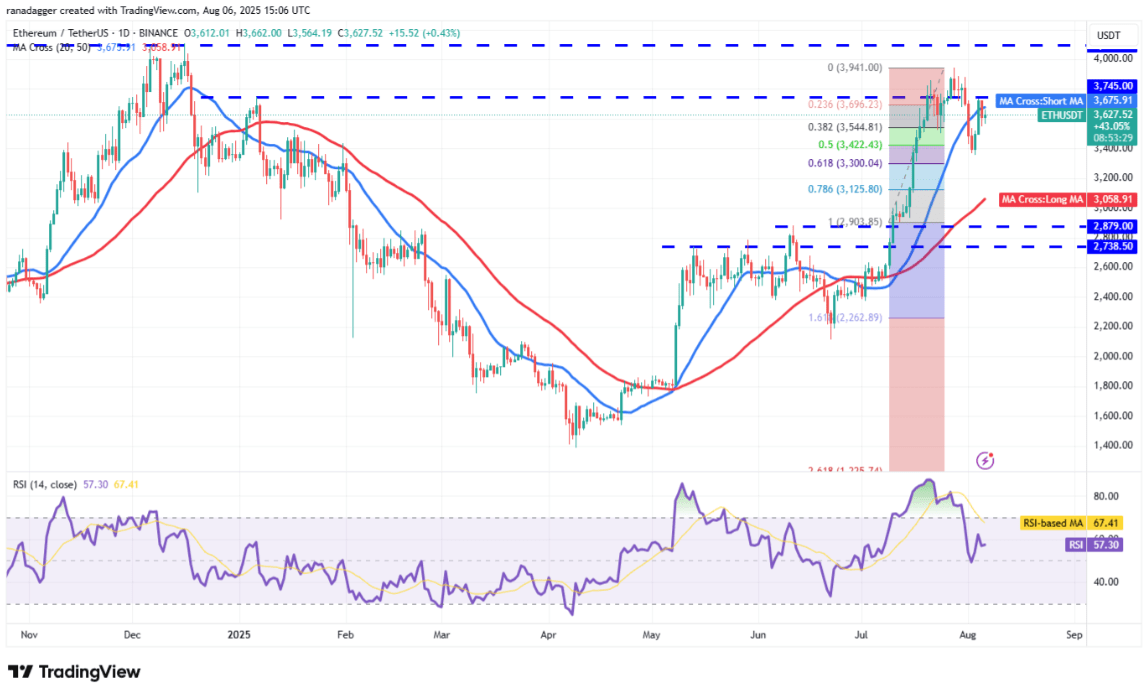
Nevertheless, a small positive signal is that the bulls are not giving up many positions, suggesting that they are expecting another upward wave. If the price surpasses the $3,745 level, the ETH/USDT pair could rise to $3.94 and then to $4.094.
However, this scenario will be invalidated in the short term if the price sharply reverses down and breaks below the 61.8% Fibonacci retracement level at $3,300. At that point, ETH could fall to the 50-day SMA ($3,058).
Technical analysis of XRP
XRP rebounded from the 50-day SMA ($2.69) on Sunday but is currently facing selling pressure near the 20-day SMA ($3.16).
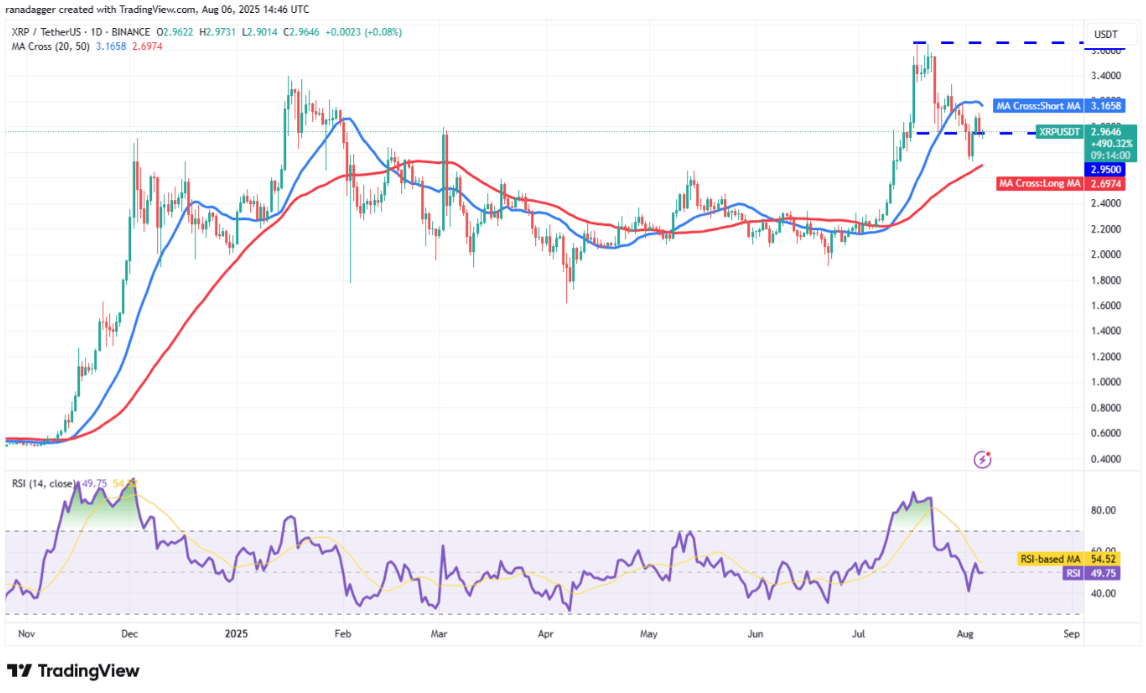
This indicates that the bulls are buying when the price falls, while the bears are selling when the price rises. As a result, the XRP/USDT pair is likely to remain stuck between the two moving averages in the near term.
To confirm that the correction phase has ended, buyers need to push the price above the 20-day SMA. At that point, the price could rise to $3.33 and then to $3.66.
Conversely, if the price breaks below the 50-day SMA, it indicates that the bulls are gradually losing control. At that point, the currency pair could plummet to $2.40.
Technical analysis of BNB
BNB's recovery is currently facing selling pressure at the 20-day SMA ($774), but the positive signal is that the bulls are still maintaining buying strength.
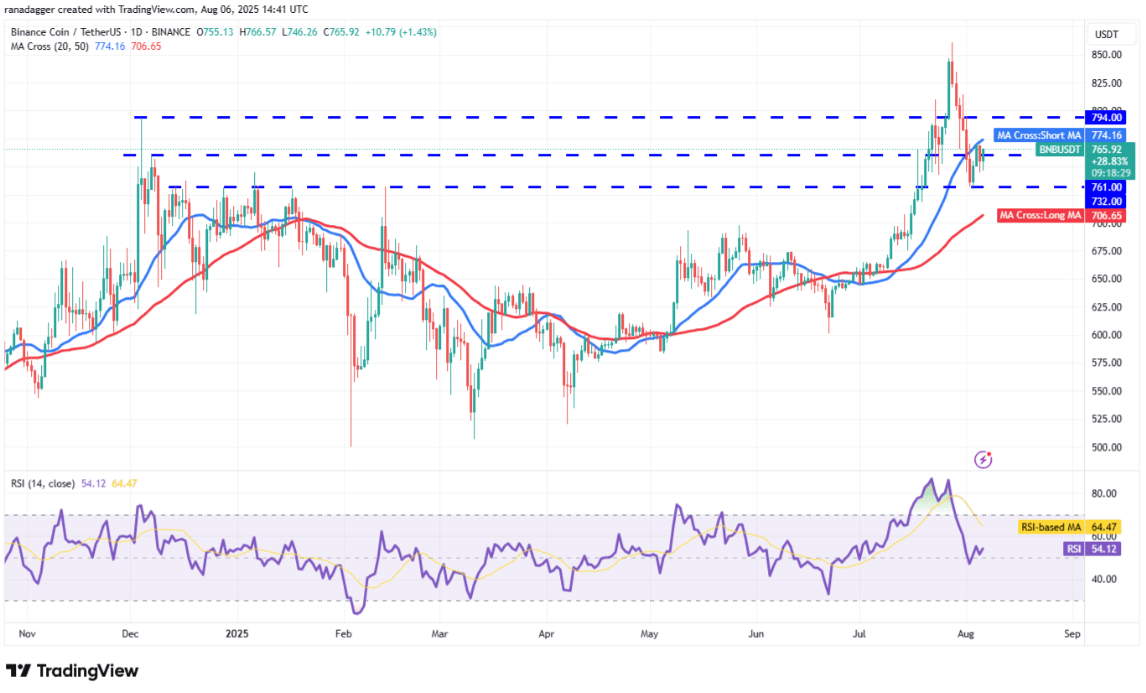
If the price breaks above the 20-day SMA, the BNB/USDT pair could rise to $794. This will be the next resistance level that the bears will attempt to block. However, if the bulls gain an advantage, the price could continue to rise to $815 and then to $861.
Conversely, if the price sharply reverses down from the 20-day SMA, it indicates that the bears are fiercely defending this level. This increases the risk of breaking the support at $732, leading to a decline towards the 50-day SMA ($706).
Technical analysis of SOL
Solana (SOL) has once again returned to the 50-day SMA ($162), indicating that recoveries are being sold off.
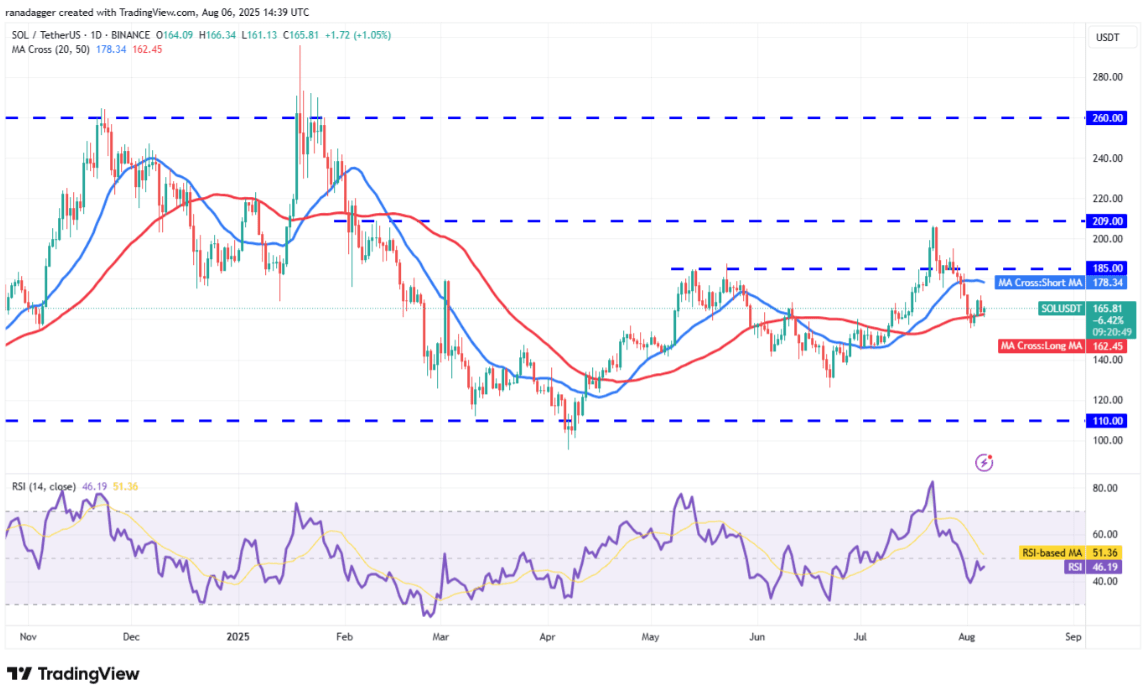
The moving average is flat and the RSI is just below the neutral level, indicating no clear advantage for either the bulls or the bears. If the price sharply rebounds from the 50-day SMA, the SOL/USDT pair could recover to the 20-day SMA ($178).
The short-term advantage will tilt towards the bulls if the price surpasses the $185 level, opening up the possibility of testing the important resistance at $209. Conversely, if it breaks below $155, SOL could drop to $144 and then to $137.
Technical analysis of DOGE
Buyers have managed to keep DOGE above the 50-day SMA ($0.19), but are struggling to approach the resistance area at $0.21.
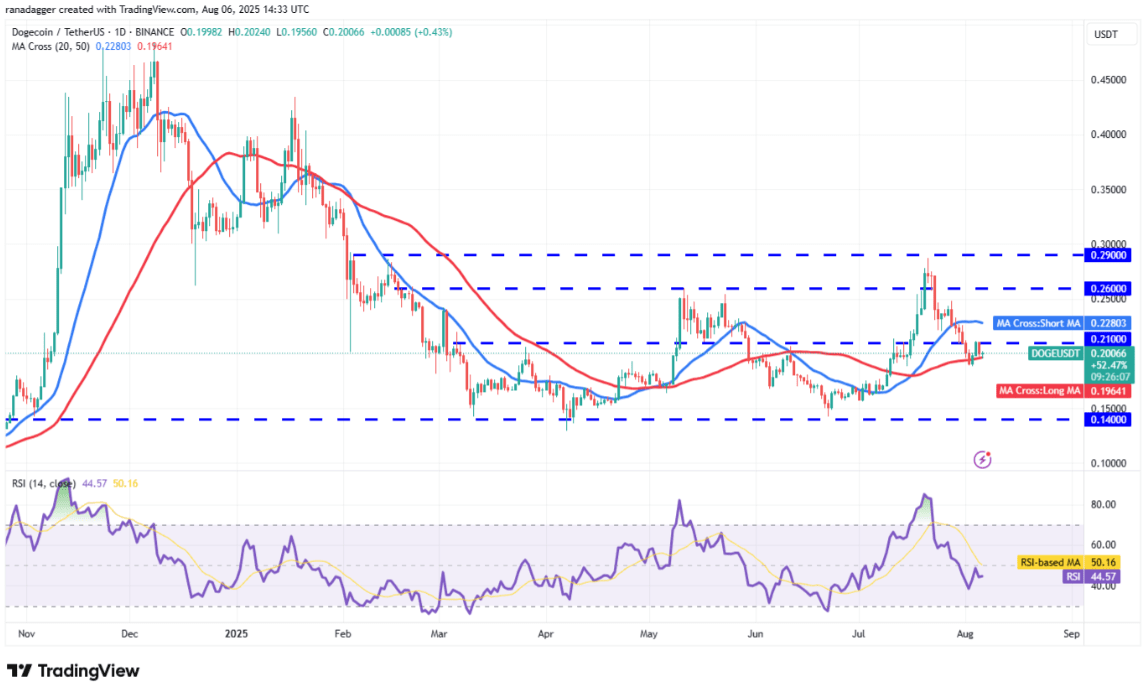
Both moving averages are moving sideways, while the RSI is just below the neutral level, signaling that price action will fluctuate within a narrow range in the short term.
If the price breaks above $0.21, the DOGE/USDT pair could rise to the 20-day SMA ($0.22). However, it is likely that the bears will strongly defend this area, causing DOGE to continue fluctuating between the two moving averages.
If the bulls cannot hold the 50-day SMA, the price of DOGE could drop to $0.17, even down to the strong support area at $0.14.
Technical analysis of ADA
Cardano (ADA) rebounded from the 50-day simple moving average (SMA) at $0.68 on Sunday, but this recovery is facing selling pressure at $0.76.
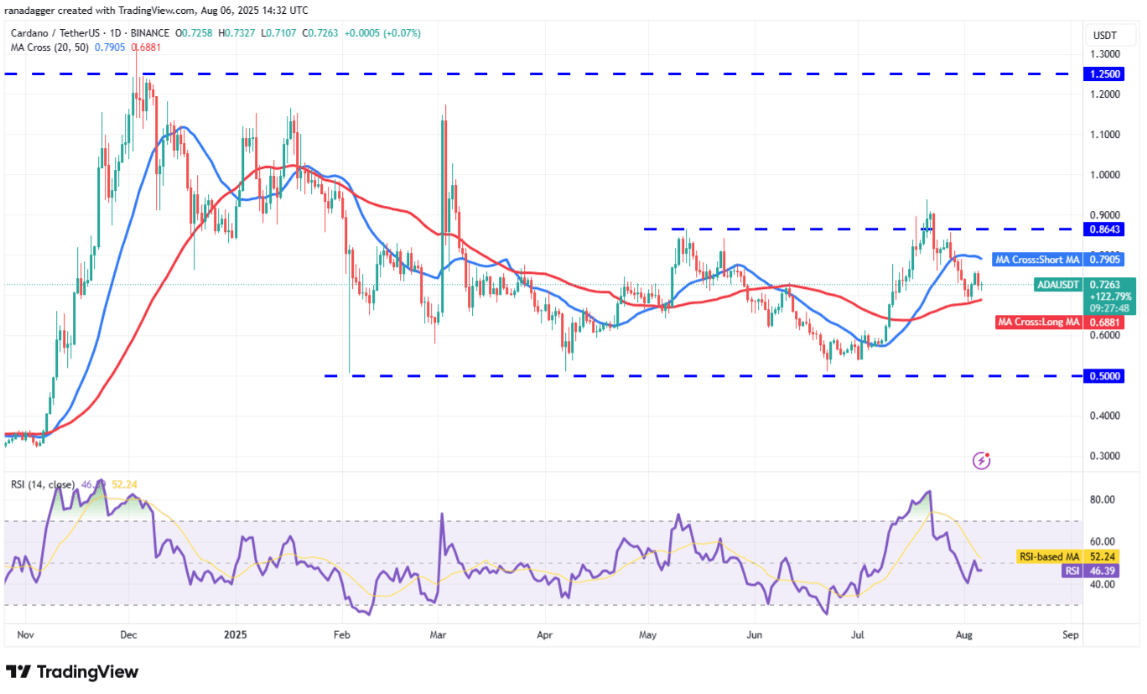
The moving averages are moving sideways and the relative strength index (RSI) is just below the average threshold, indicating a sideways trend in the short term. The ADA/USDT pair may fluctuate between the moving averages in the coming days.
The bears will gain an advantage if the price breaks below the 50-day SMA. In that scenario, the price of ADA could plummet to the $0.56 range. Conversely, if the price breaks above the 20-day SMA ($0.79), the upward momentum could push Cardano's price to $0.86.
Technical analysis of HYPE
The recovery of Hyperliquid (HYPE) from the $35.51 level has weakened near the 50-day SMA ($40.99), indicating that market sentiment is turning negative and traders are taking profits as the price retraces.
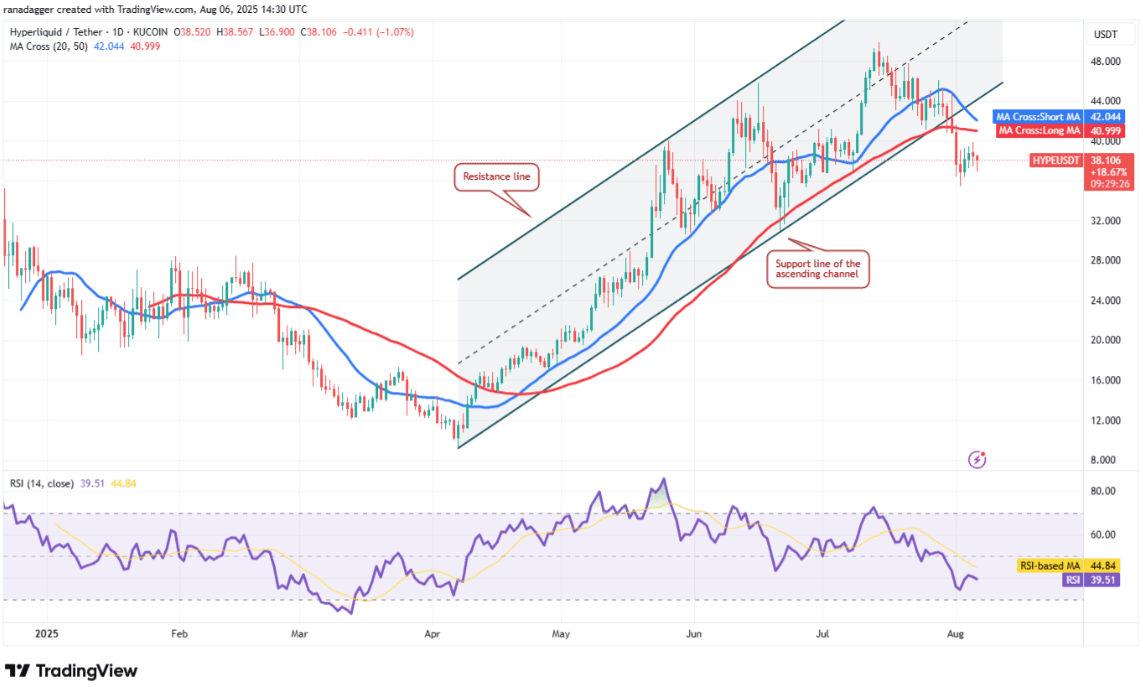
The moving averages are about to form a bearish cross, while the RSI has fallen into the negative zone, indicating that the bears are trying to take control. If the price slips below $35.50, the HYPE/USDT pair could drop significantly to $32.
In the event of a bounce, the bears are likely to defend the area between the 50-day SMA and the support line of the price channel. The bulls need to push the price of HYPE back into the channel to show that the correction phase may have ended.
Technical analysis of XLM
Stellar (XLM) dropped from the 20-day SMA ($0.42) on Monday, indicating that the bears are selling as the price retraces.
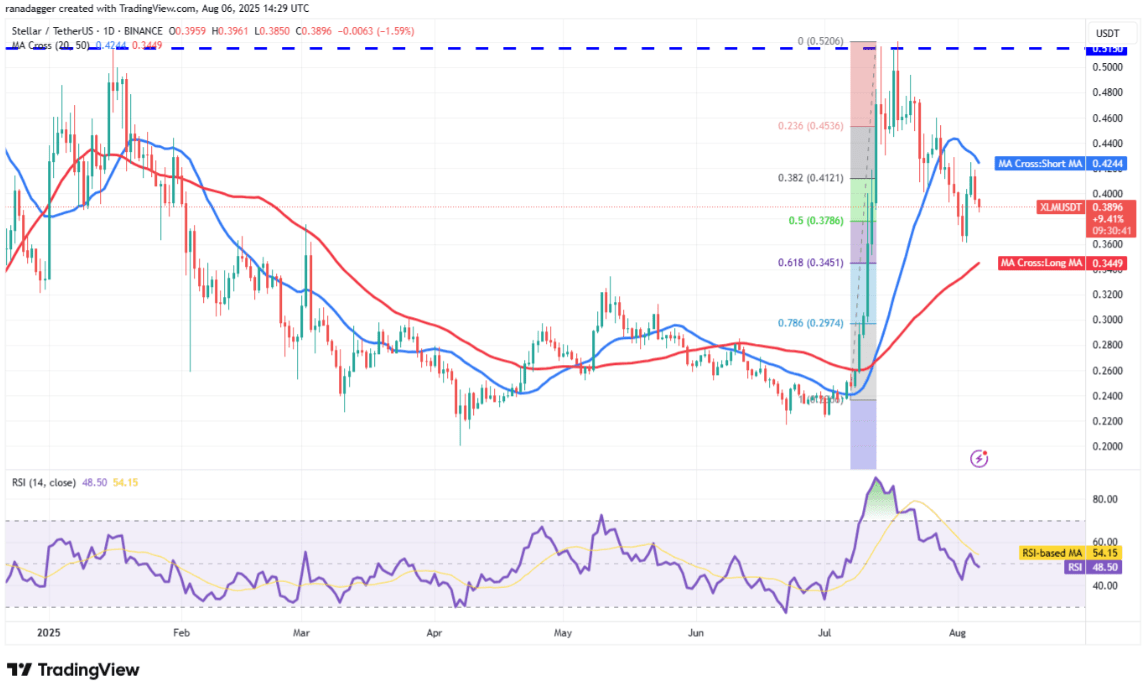
The XLM/USDT pair may drop to the 50-day SMA ($0.34), where buying pressure is expected to emerge. If the price rebounds from the 50-day SMA, this pair could continue to fluctuate within the range between the two moving averages for some time.
The next trend is likely to form when the price breaks above one of the two levels: above the 20-day SMA or below the 50-day SMA. If the price surpasses the 20-day SMA, it indicates that the correction process may have ended. Conversely, if it breaks below the 50-day SMA, the price of XLM could drop significantly to $0.29.
Technical analysis of SUI
Sui (SUI) has adjusted to the 50-day SMA ($3.32), indicating that the bears are still maintaining selling pressure.
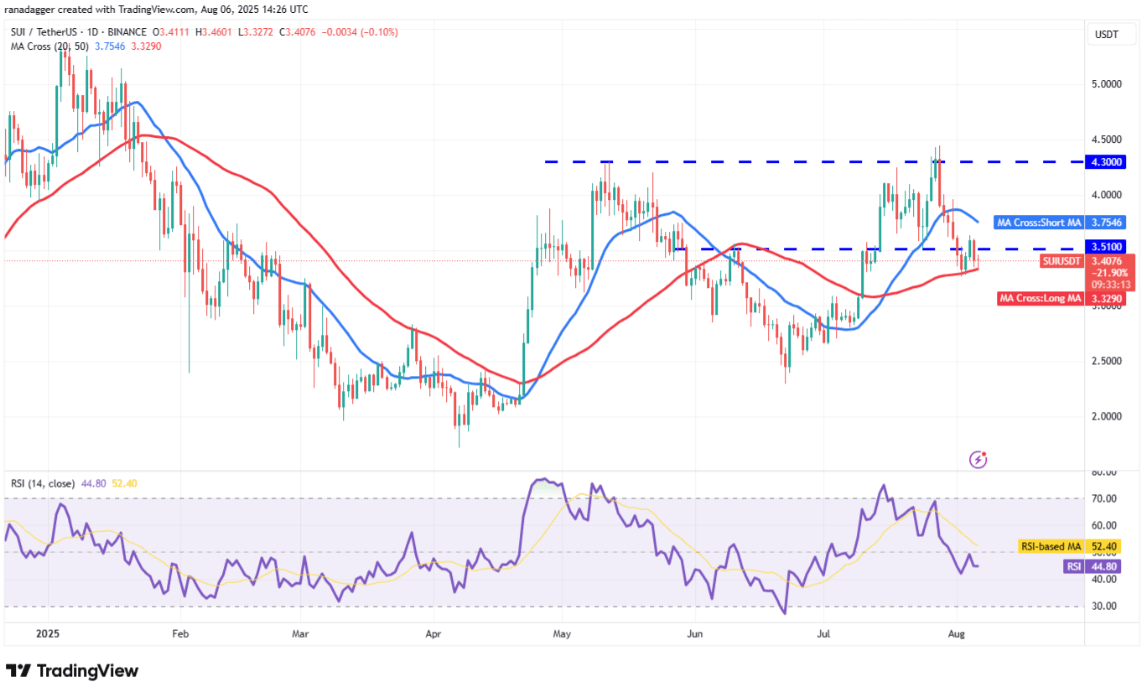
The 20-day SMA ($3.75) has started to slope down, and the RSI is below 45, suggesting that the bears hold a slight advantage. The bears are expected to defend at the 20-day SMA if the price retraces. If the price reverses down from the 20-day SMA, the likelihood of breaking below the 50-day SMA will increase. At that point, the SUI/USDT pair could drop to $2.87, and then to $2.65.
The bulls need to push the price above the 20-day SMA to prevent the downtrend. If successful, the price of SUI could begin a recovery towards $4 and then face resistance at $4.30.