Based on the latest data (Price **XRP = 3.0064**), and the analysis of indicators in the three images, here is the overall assessment:
---
### 📊 **Technical Summary**
| Indicator | Value/Signal | Interpretation |
|----------------------|---------------------|----------------------------|
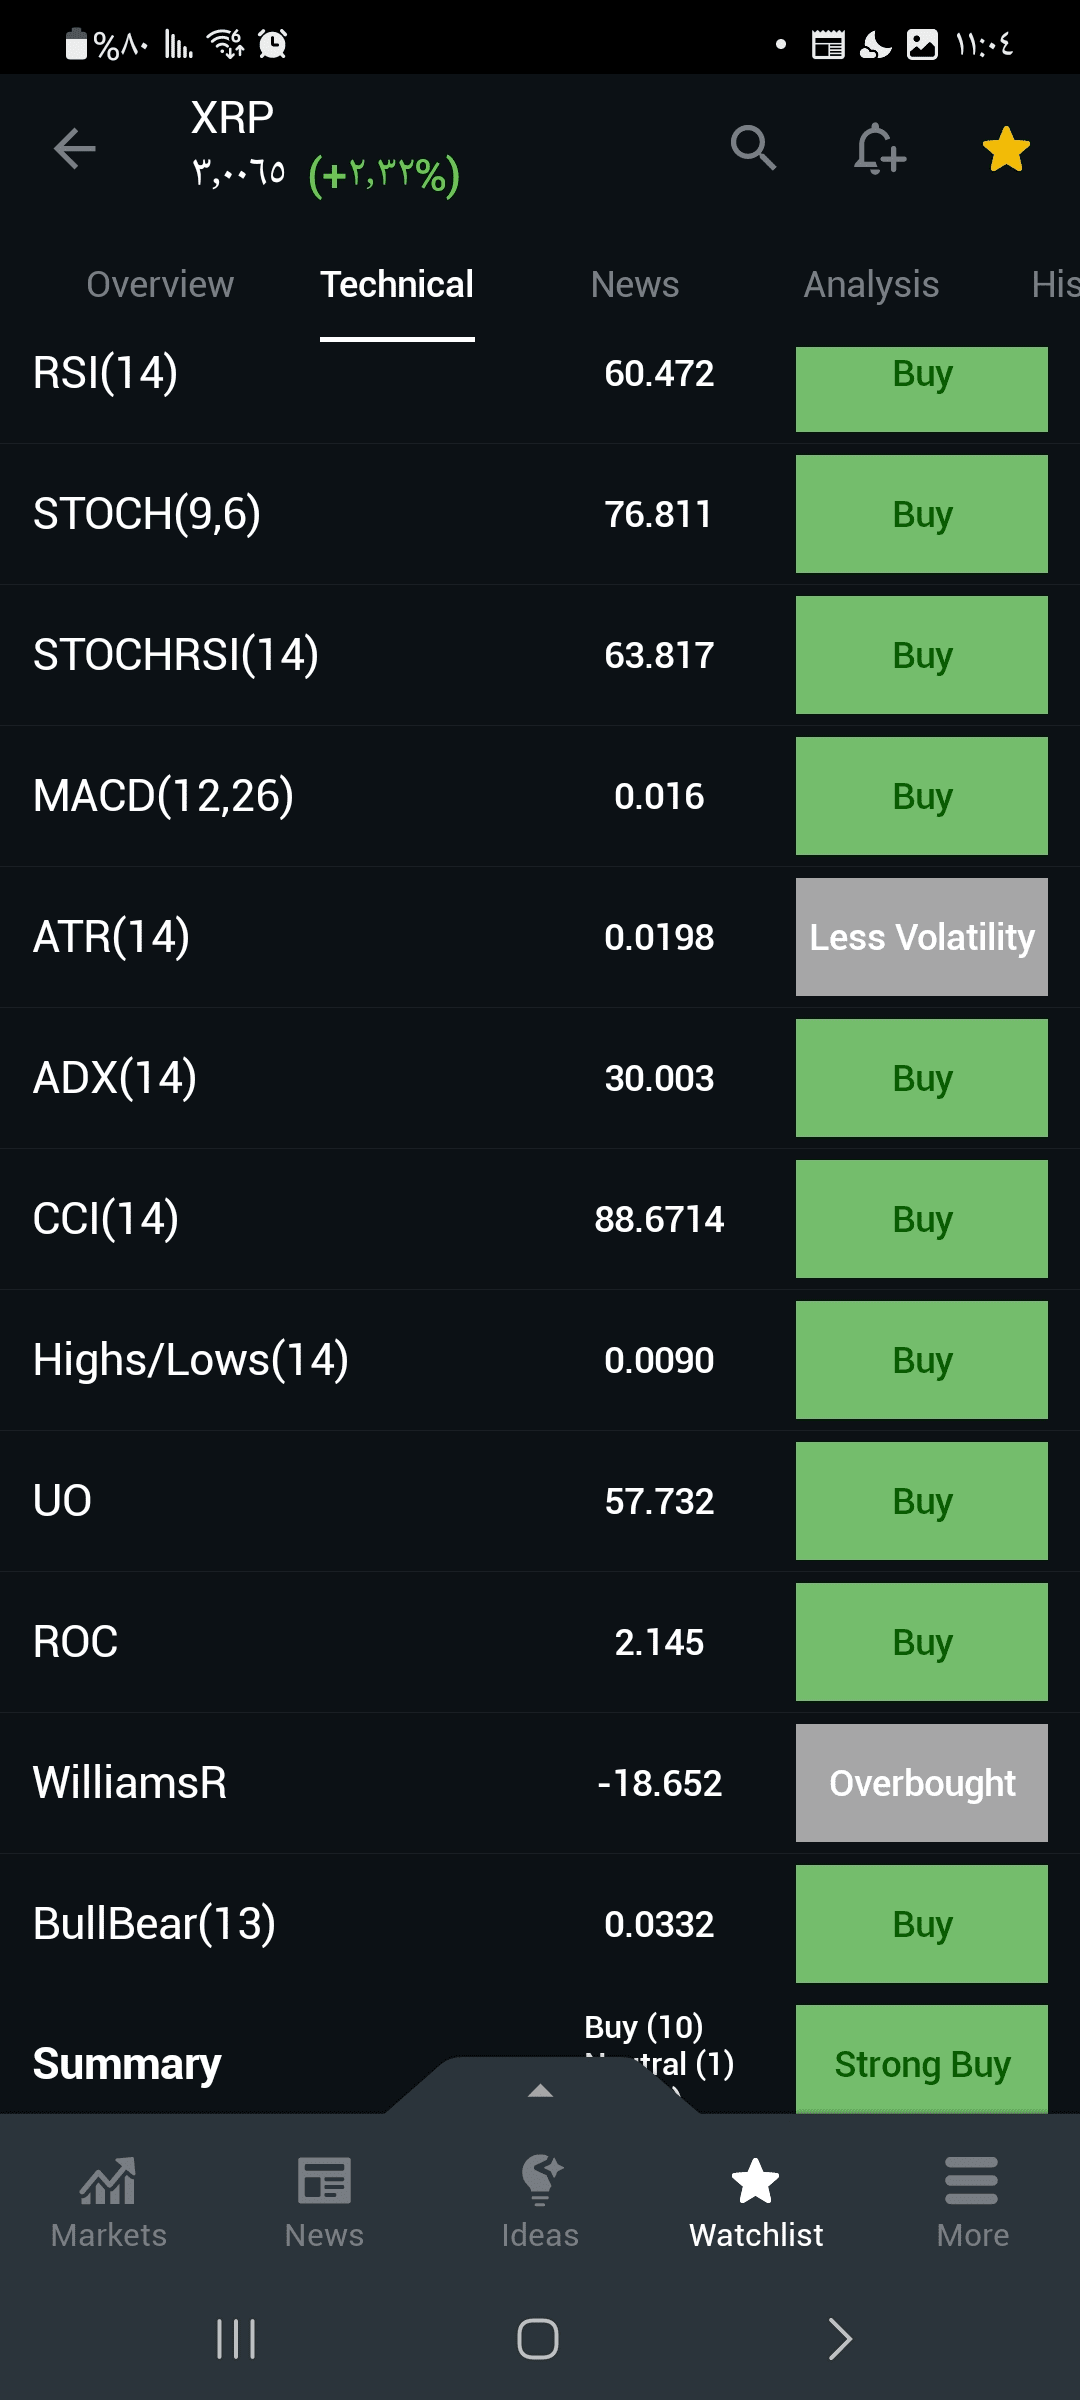
| **Overall Trend** | ✔️ **Strong Bullish** | 10 Buy signals vs 1 Sell (technical indicators) |
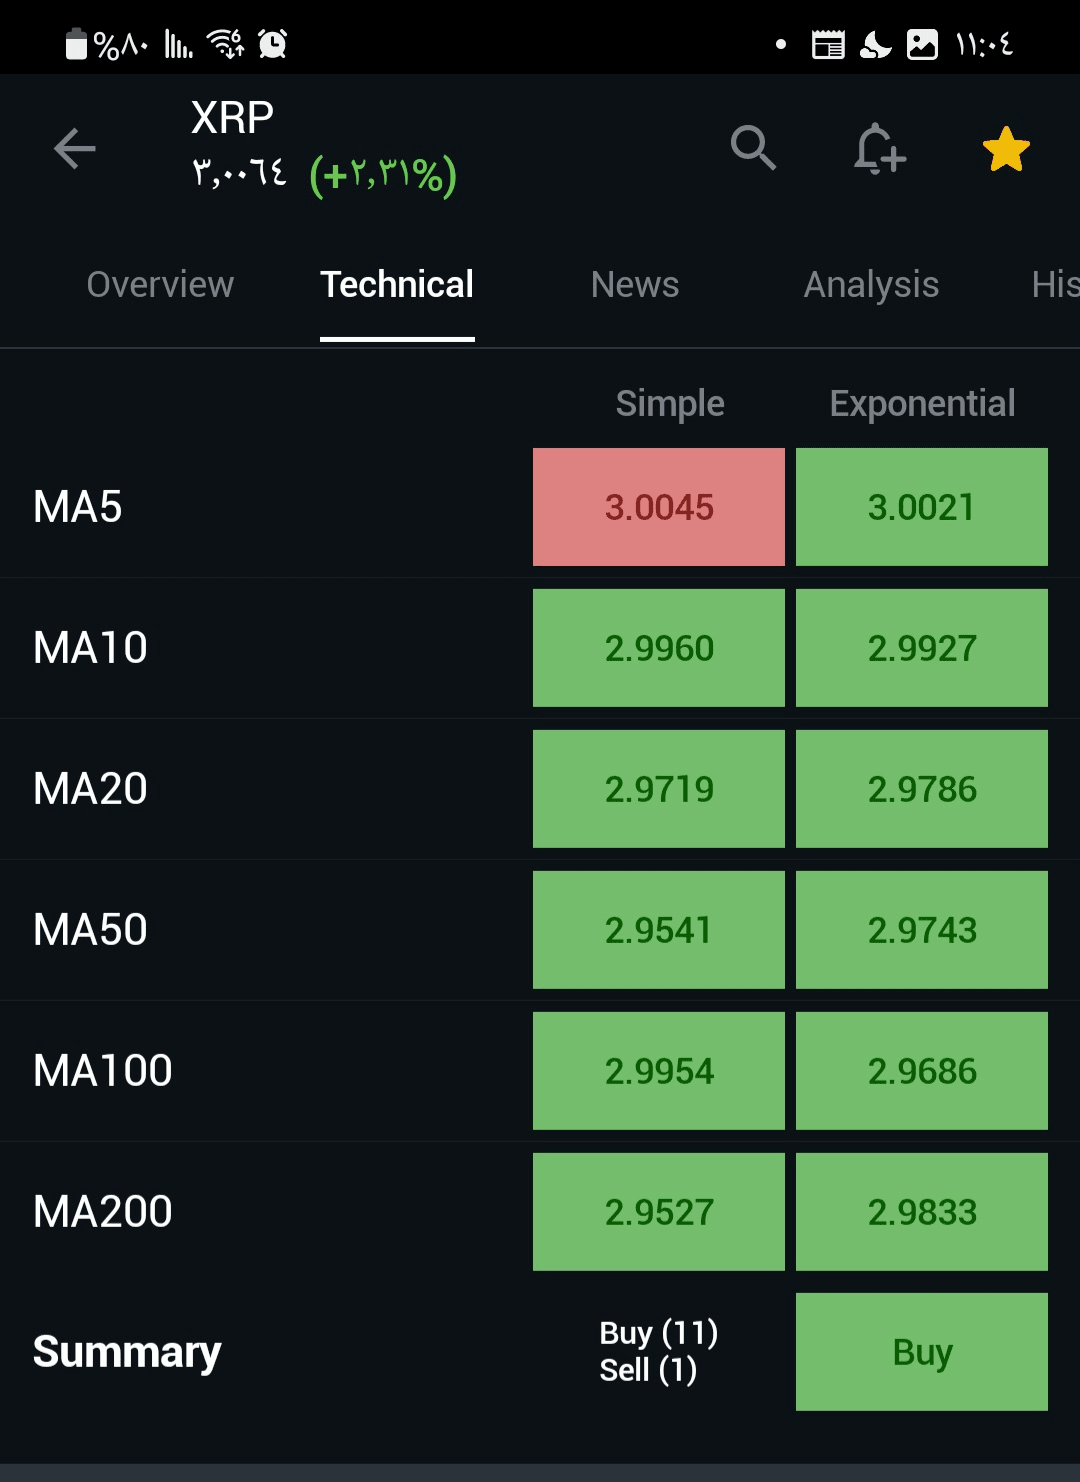
| **Moving Averages** | ✔️ **Buy** (11 Signals) | Price above all averages (MA5 to MA200) |
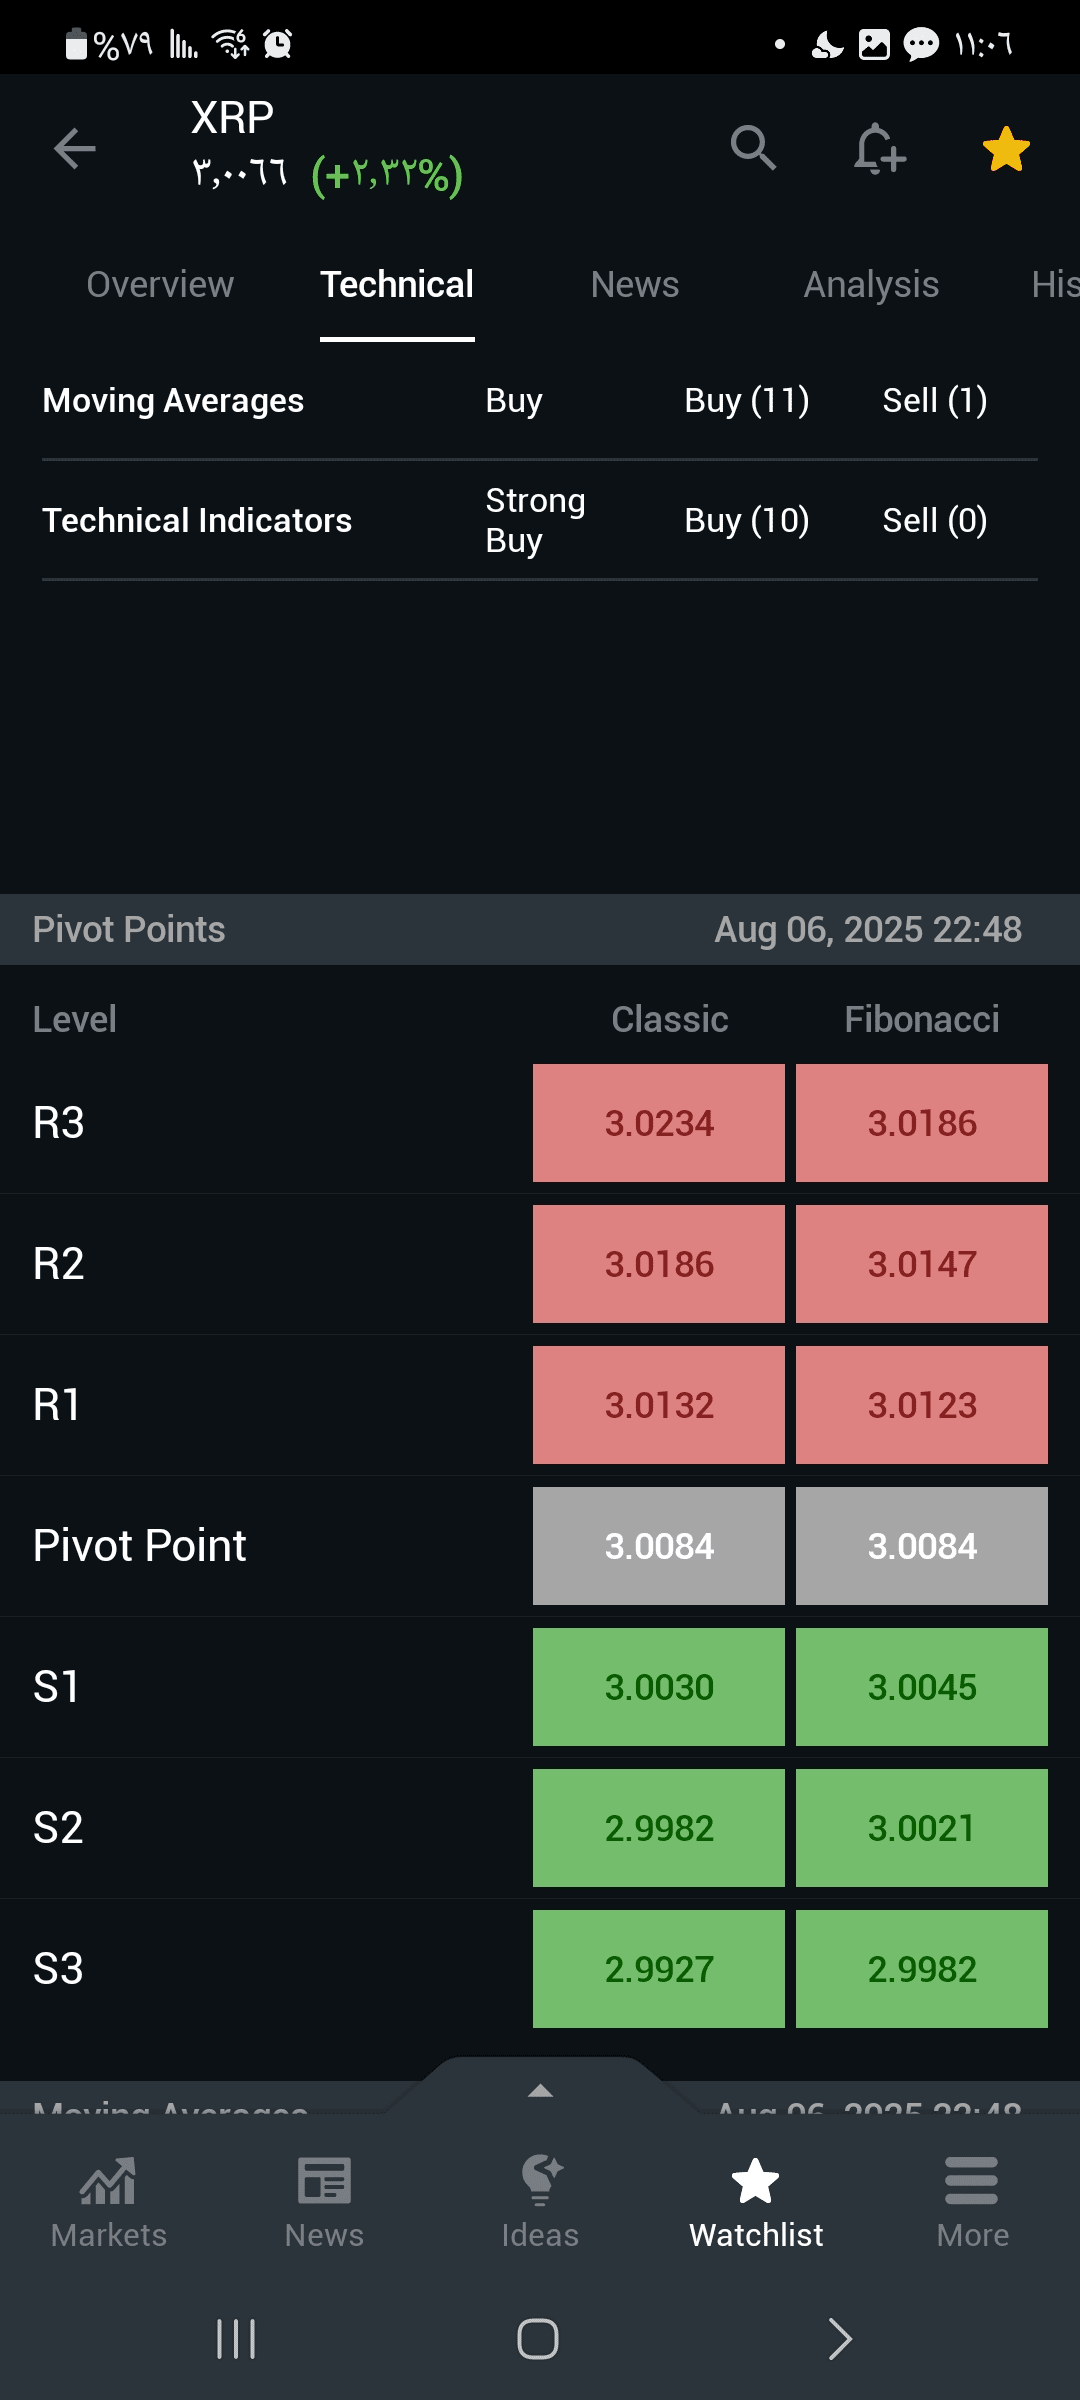
| **Pivot Points** | 🎯 **Critical** | Current Price (3.0064) near **Resistance R1 (3.0132)** |
---
### 🔍 **Detailed Analysis**
1. **Strength of the bullish trend**:
- **Leading Indicators Positive**:
- MACD: **+0.016** (Buy signal).
- ADX: **30.003** (Strong bullish trend).
- Stochastic: **76.811** (in overbought territory but still rising).
- **Indicator Consensus**: 10/11 signals "Buy" or "Strong Buy".
2. **Moving Averages**:
- **Price (3.0064) above all averages**:
- MA5: **3.0045**
- MA50: **2.9541**
- MA200: **2.9527**
- **Formation of "Golden Crossing"**: MA50 above MA200 → Long-term bullish confirmation.
3. **Critical Pivot Points**:
| Level | Price | Importance |
|----------|----------|---------------------|
| **R1** | 3.0132 | Immediate Resistance |
| **S1** | 3.0084 | Direct Support |
- Current price **(3.0064)** between **S1** and **R1** → Decision area.
---
### ⚖️ **Trading Recommendation**
#### ✅ **Buy Now with Conditions**:
1. **Entry at**:
- Break **3.0132 (R1)** with trading volume > **500K** (breakout confirmation).
- Or a bounce from **3.0084 (S1)** with confirmation from indicators (like RSI rising above 60).
2. **Profit Targets**:
- Short term: **3.0186 (R2)**.
- Average Range: **3.0234 (R3)**.
3. **Stop Loss**:
- Below **3.0030 (S2)** → Capital protection.
#### ⚠️ **Warnings**:
- **Overbought**: Williams %R at **-18.652** (Overbought territory) → Potential for a near correction.
- **Weak Volume** (as in previous analysis) → Needs confirmation for upward continuation.
---
### 📉 **Selling Scenario**
- **If the price breaks 3.0030 (S2)**:
- Sell signal with target at **2.9982 (S3)**.
- Reason: failure to hold support + confirmation of bearish reversal.
---
### 📌 **Summary**:
- **Current Timing**:
- ✔️ **Risky Buying Opportunity** (due to proximity to Resistance R1).
- 🎯 **Best**: wait for:
- **Breakout at 3.0132** (for safe buying entry).
- **Bounce to 3.0000-3.0030** (to buy at better prices).
- **Risks**:
- Potential correction due to overbought → Do not buy without a stop loss.
> 🔍 **Final Note**:
> - Data shows a technical consensus on **bullish strength**, but the exact timing for entry depends on risk management.
> - If you are conservative: wait for confirmation of the breakout or a bounce from support.