
📊 Technical Analysis Breakdown:
🔴 Support Zone (Demand Area):
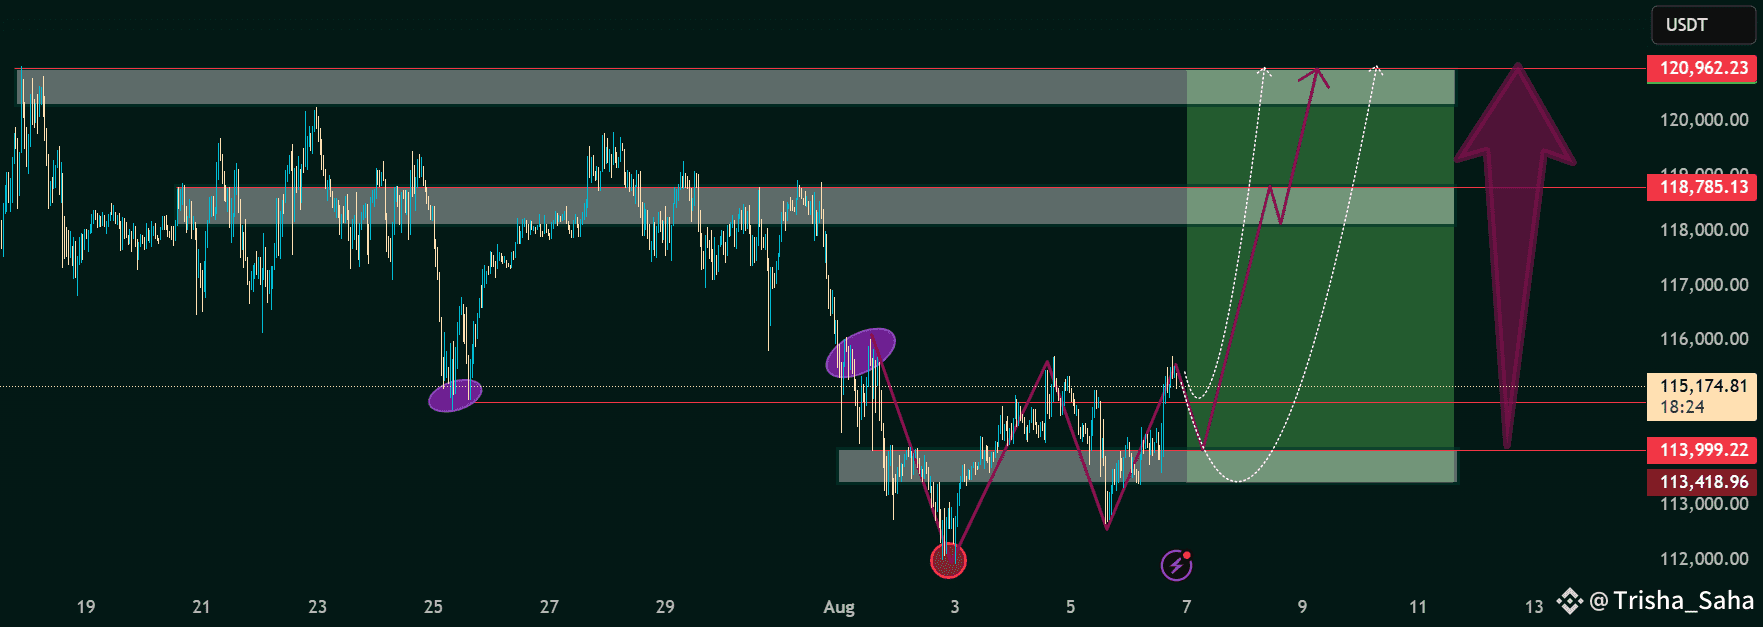
The price recently bounced from a well-defined demand zone around 113,999 – 113,418 USDT (highlighted in green). This level acted as a key support previously (left purple ovals), confirming buyer interest.
🔵 Reversal Pattern - Inverse Head & Shoulders 🧠📉📈:
A clear Inverse Head and Shoulders pattern is visible, suggesting a potential bullish reversal.
Left Shoulder: Early dip
Head: Deeper low marked with a red circle
Right Shoulder: Higher low completing the pattern
🟢 Break of Structure:
Price is attempting a neckline breakout above 115,000 USDT, a key confirmation level. A successful breakout here could trigger bullish continuation.
🎯 Bullish Target Zones:
🧱 First Resistance Block:
118,785 USDT – Potential rejection zone but key for further upside.
🏁 Final Target Zone:
120,962 USDT – Major resistance zone; aligns with previous supply & liquidity levels.
📉 Risk Zone / Invalid Structure:
If price drops below 113,999 USDT, the bullish setup may invalidate.
113,418 USDT is the final defense support.
🛠️ Trade Plan Summary:
Entry Zone: Break and retest of 115,000 USDT (confirmation needed)
Stop Loss: Below 113,999 USDT
Target 1: 118,785 USDT
Target 2: 120,962 USDT
✅ Conclusion:
The chart reflects a high-probability bullish reversal pattern supported by strong technical structure and historical demand. Traders should monitor the breakout and retest for potential entry with controlled risk. 📊🚀
#notcoin #BuiltonSolayer #IPOWave #BTCUnbound #CFTCCryptoSprint
