Visual: Side-by-Side 1D Chart of BTC & GBPUSD – Similarities or Divergence?
Let's break down the side-by-side 1D charts of BTC/USDT and GBP/USD to analyze potential similarities and divergences in their recent price action.
1. Trend Patterns
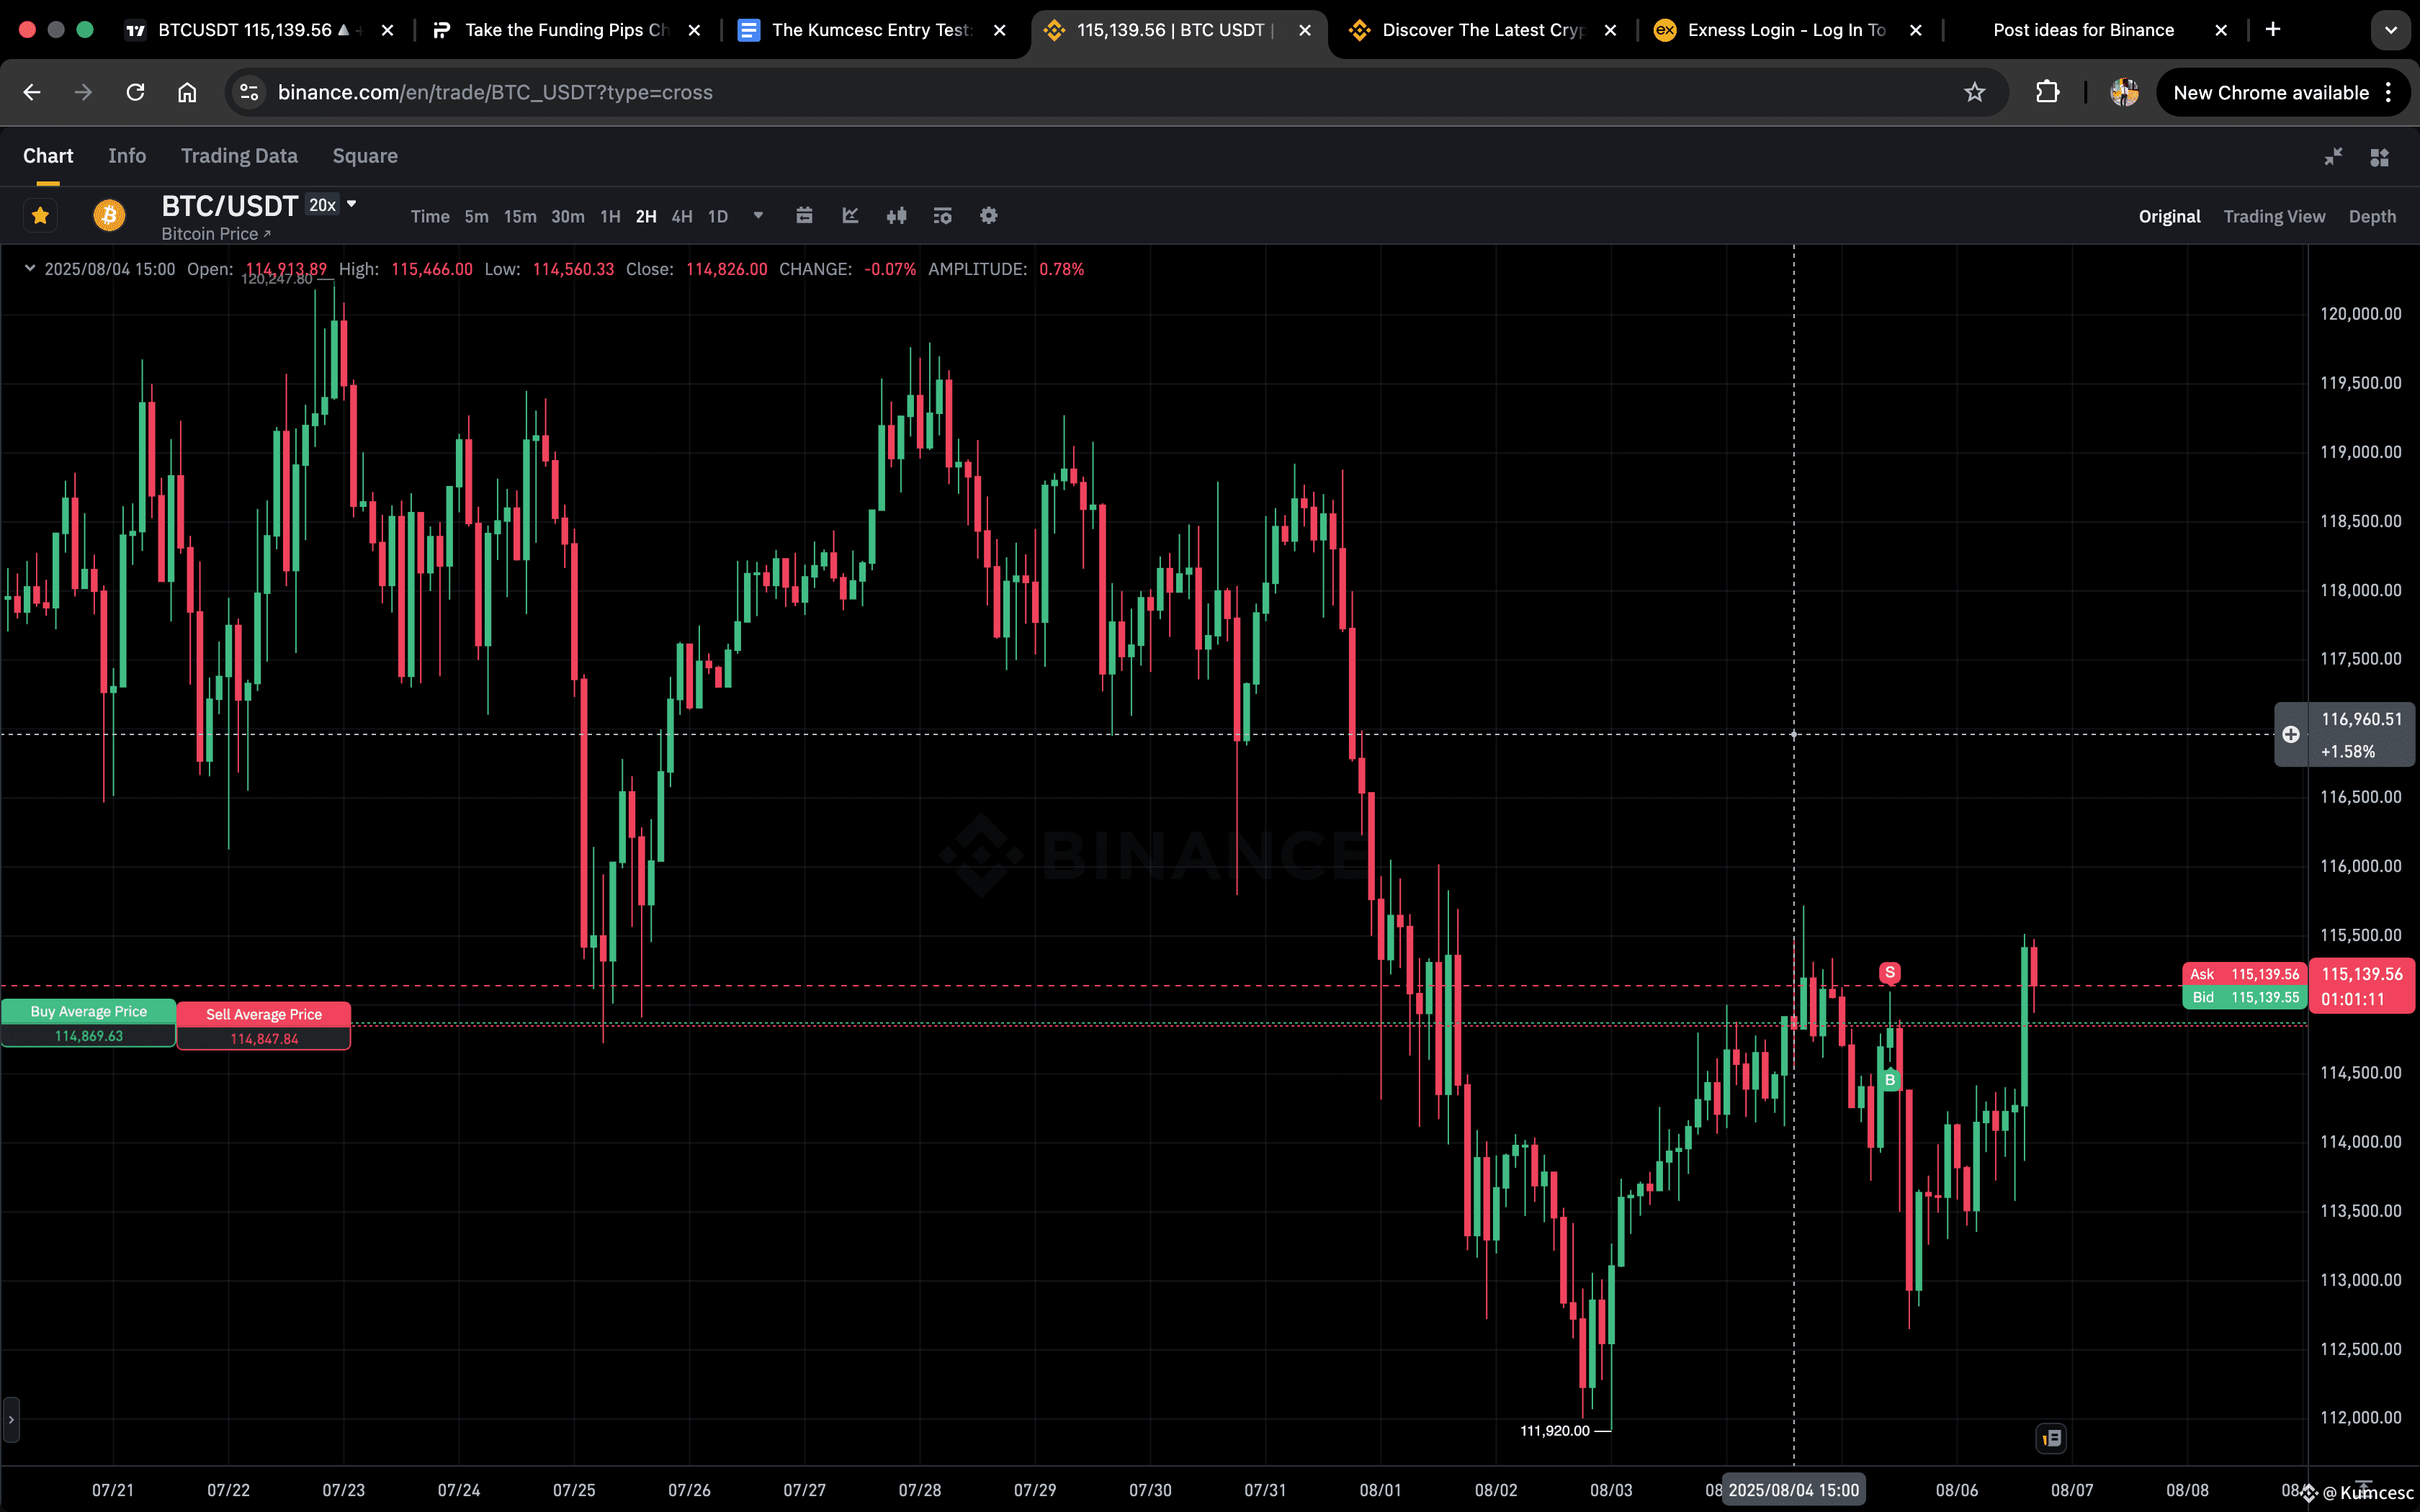
BTC/USDT: The chart shows Bitcoin's recent price action exhibiting a clear downtrend until the first week of August, followed by a strong bullish reversal. Bitcoin sharply bounced back from its low around 111,900 and surged towards 115,000 levels, signaling potential bullish momentum.
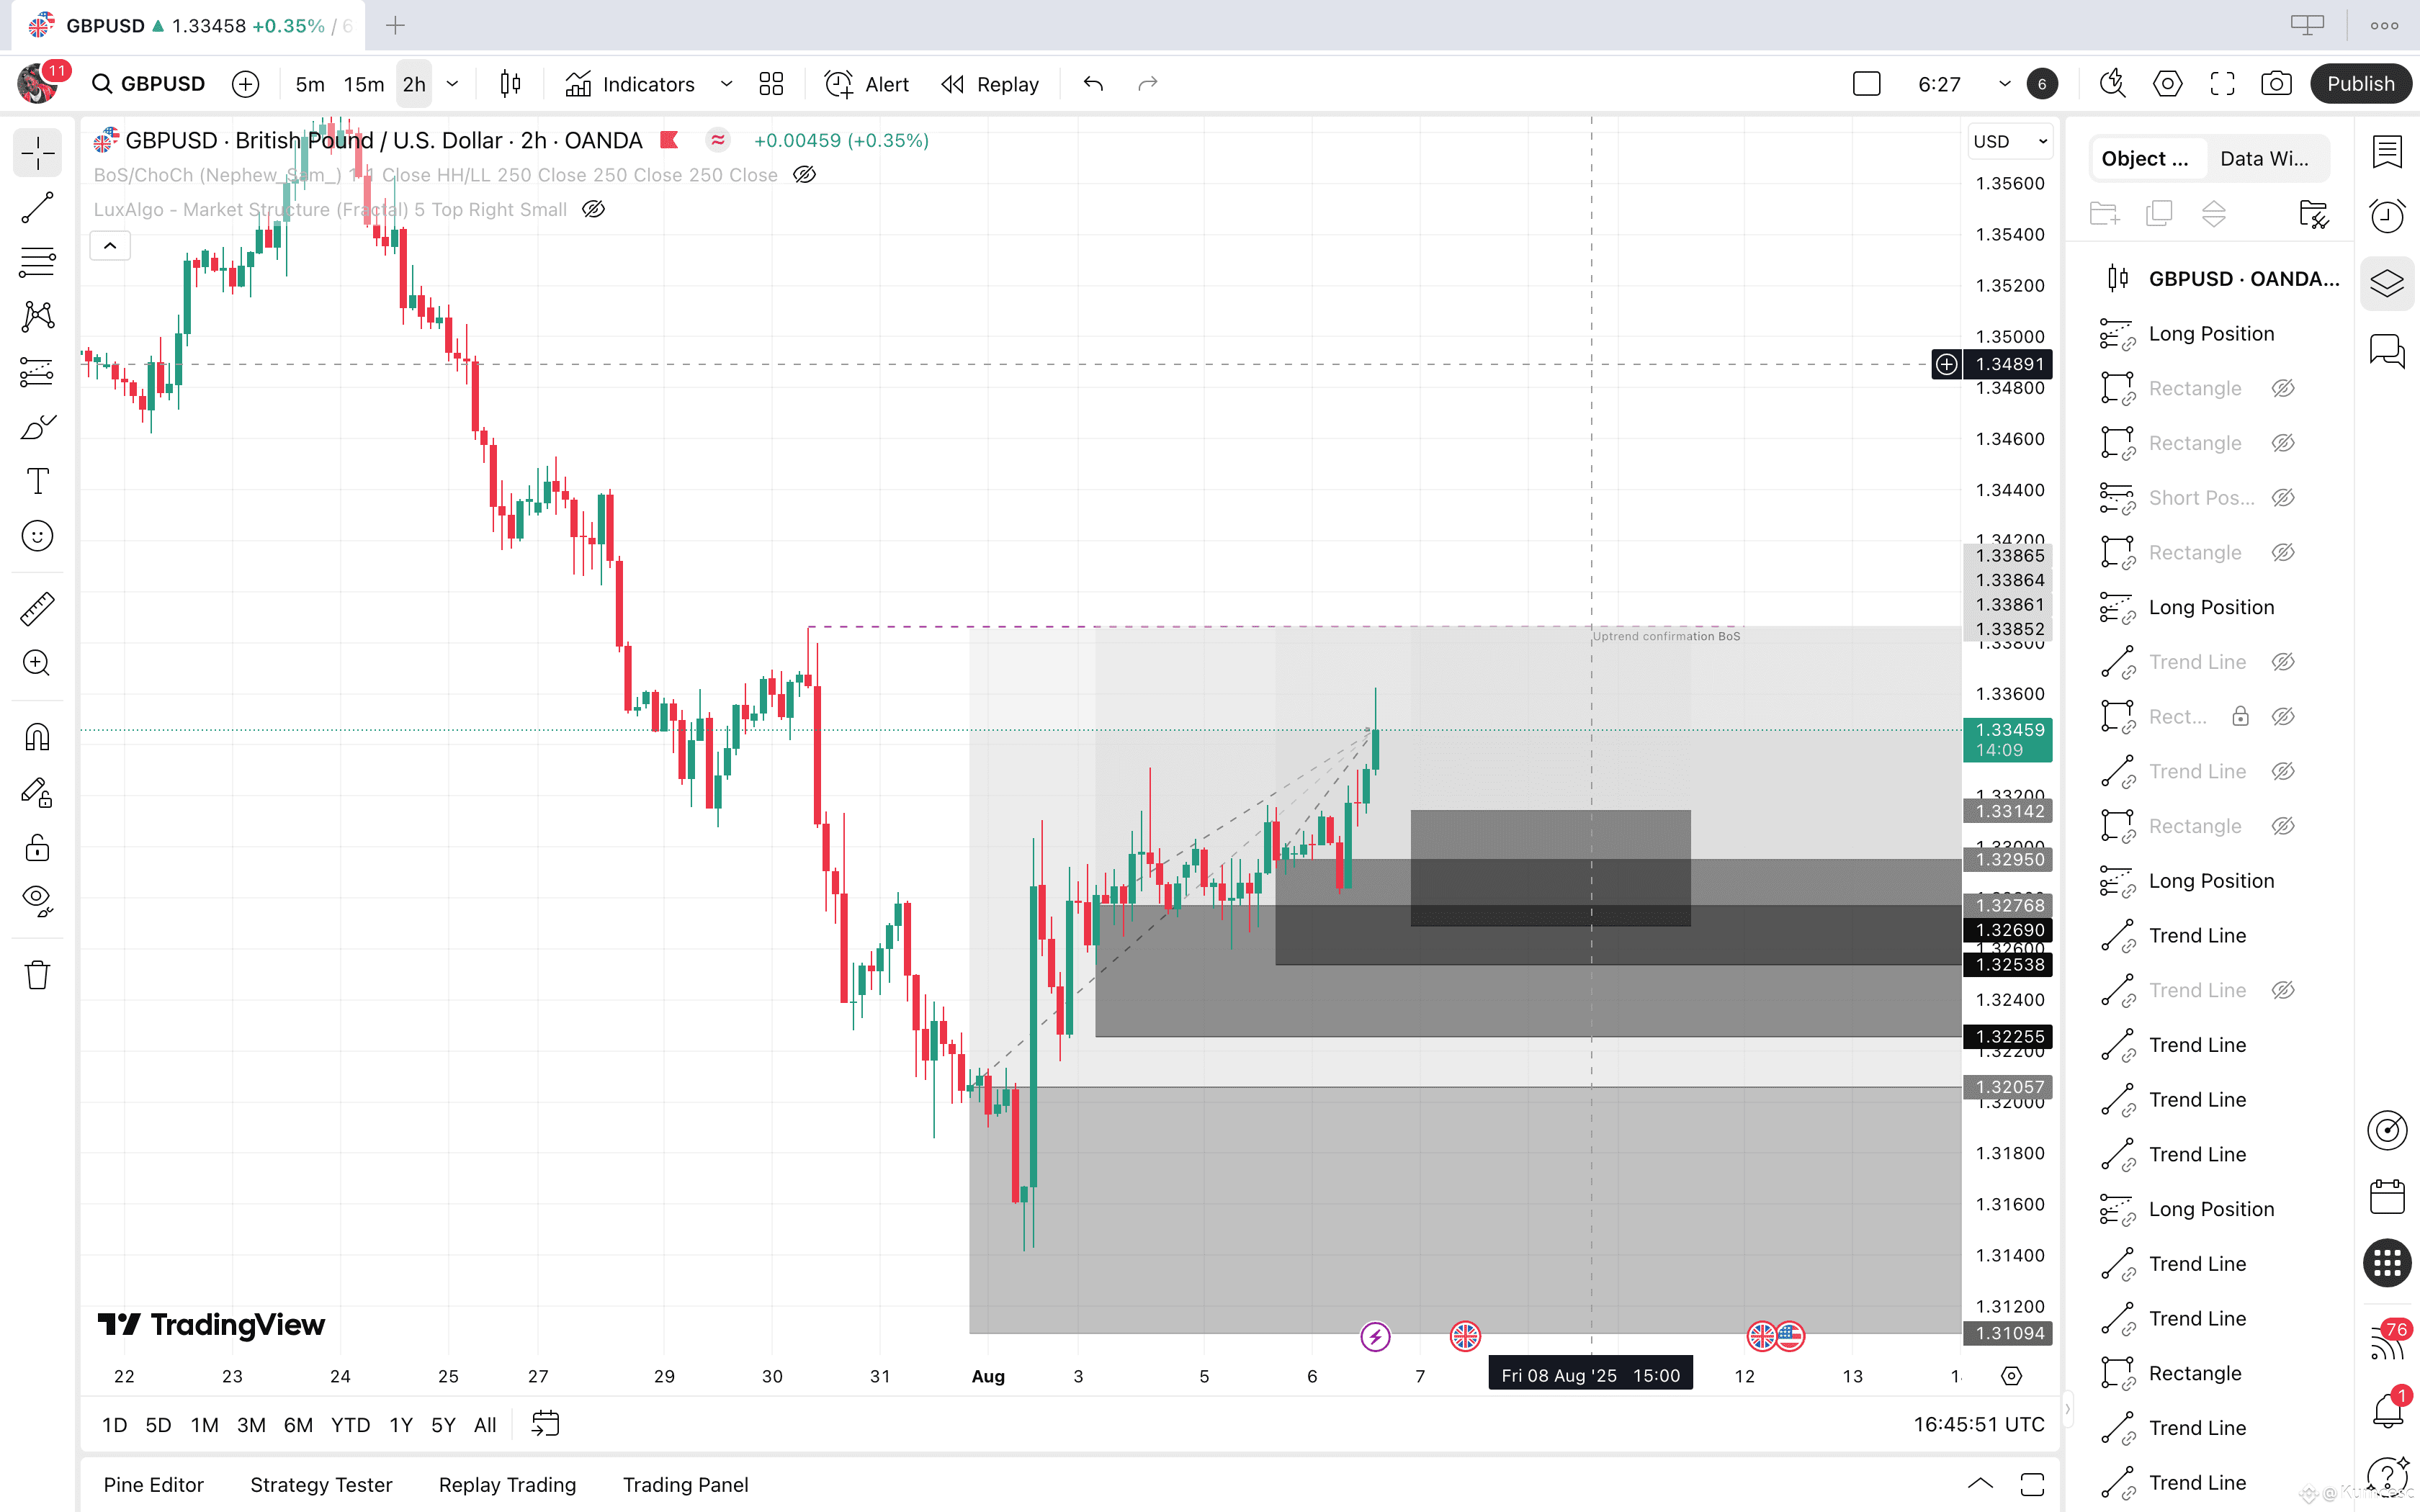
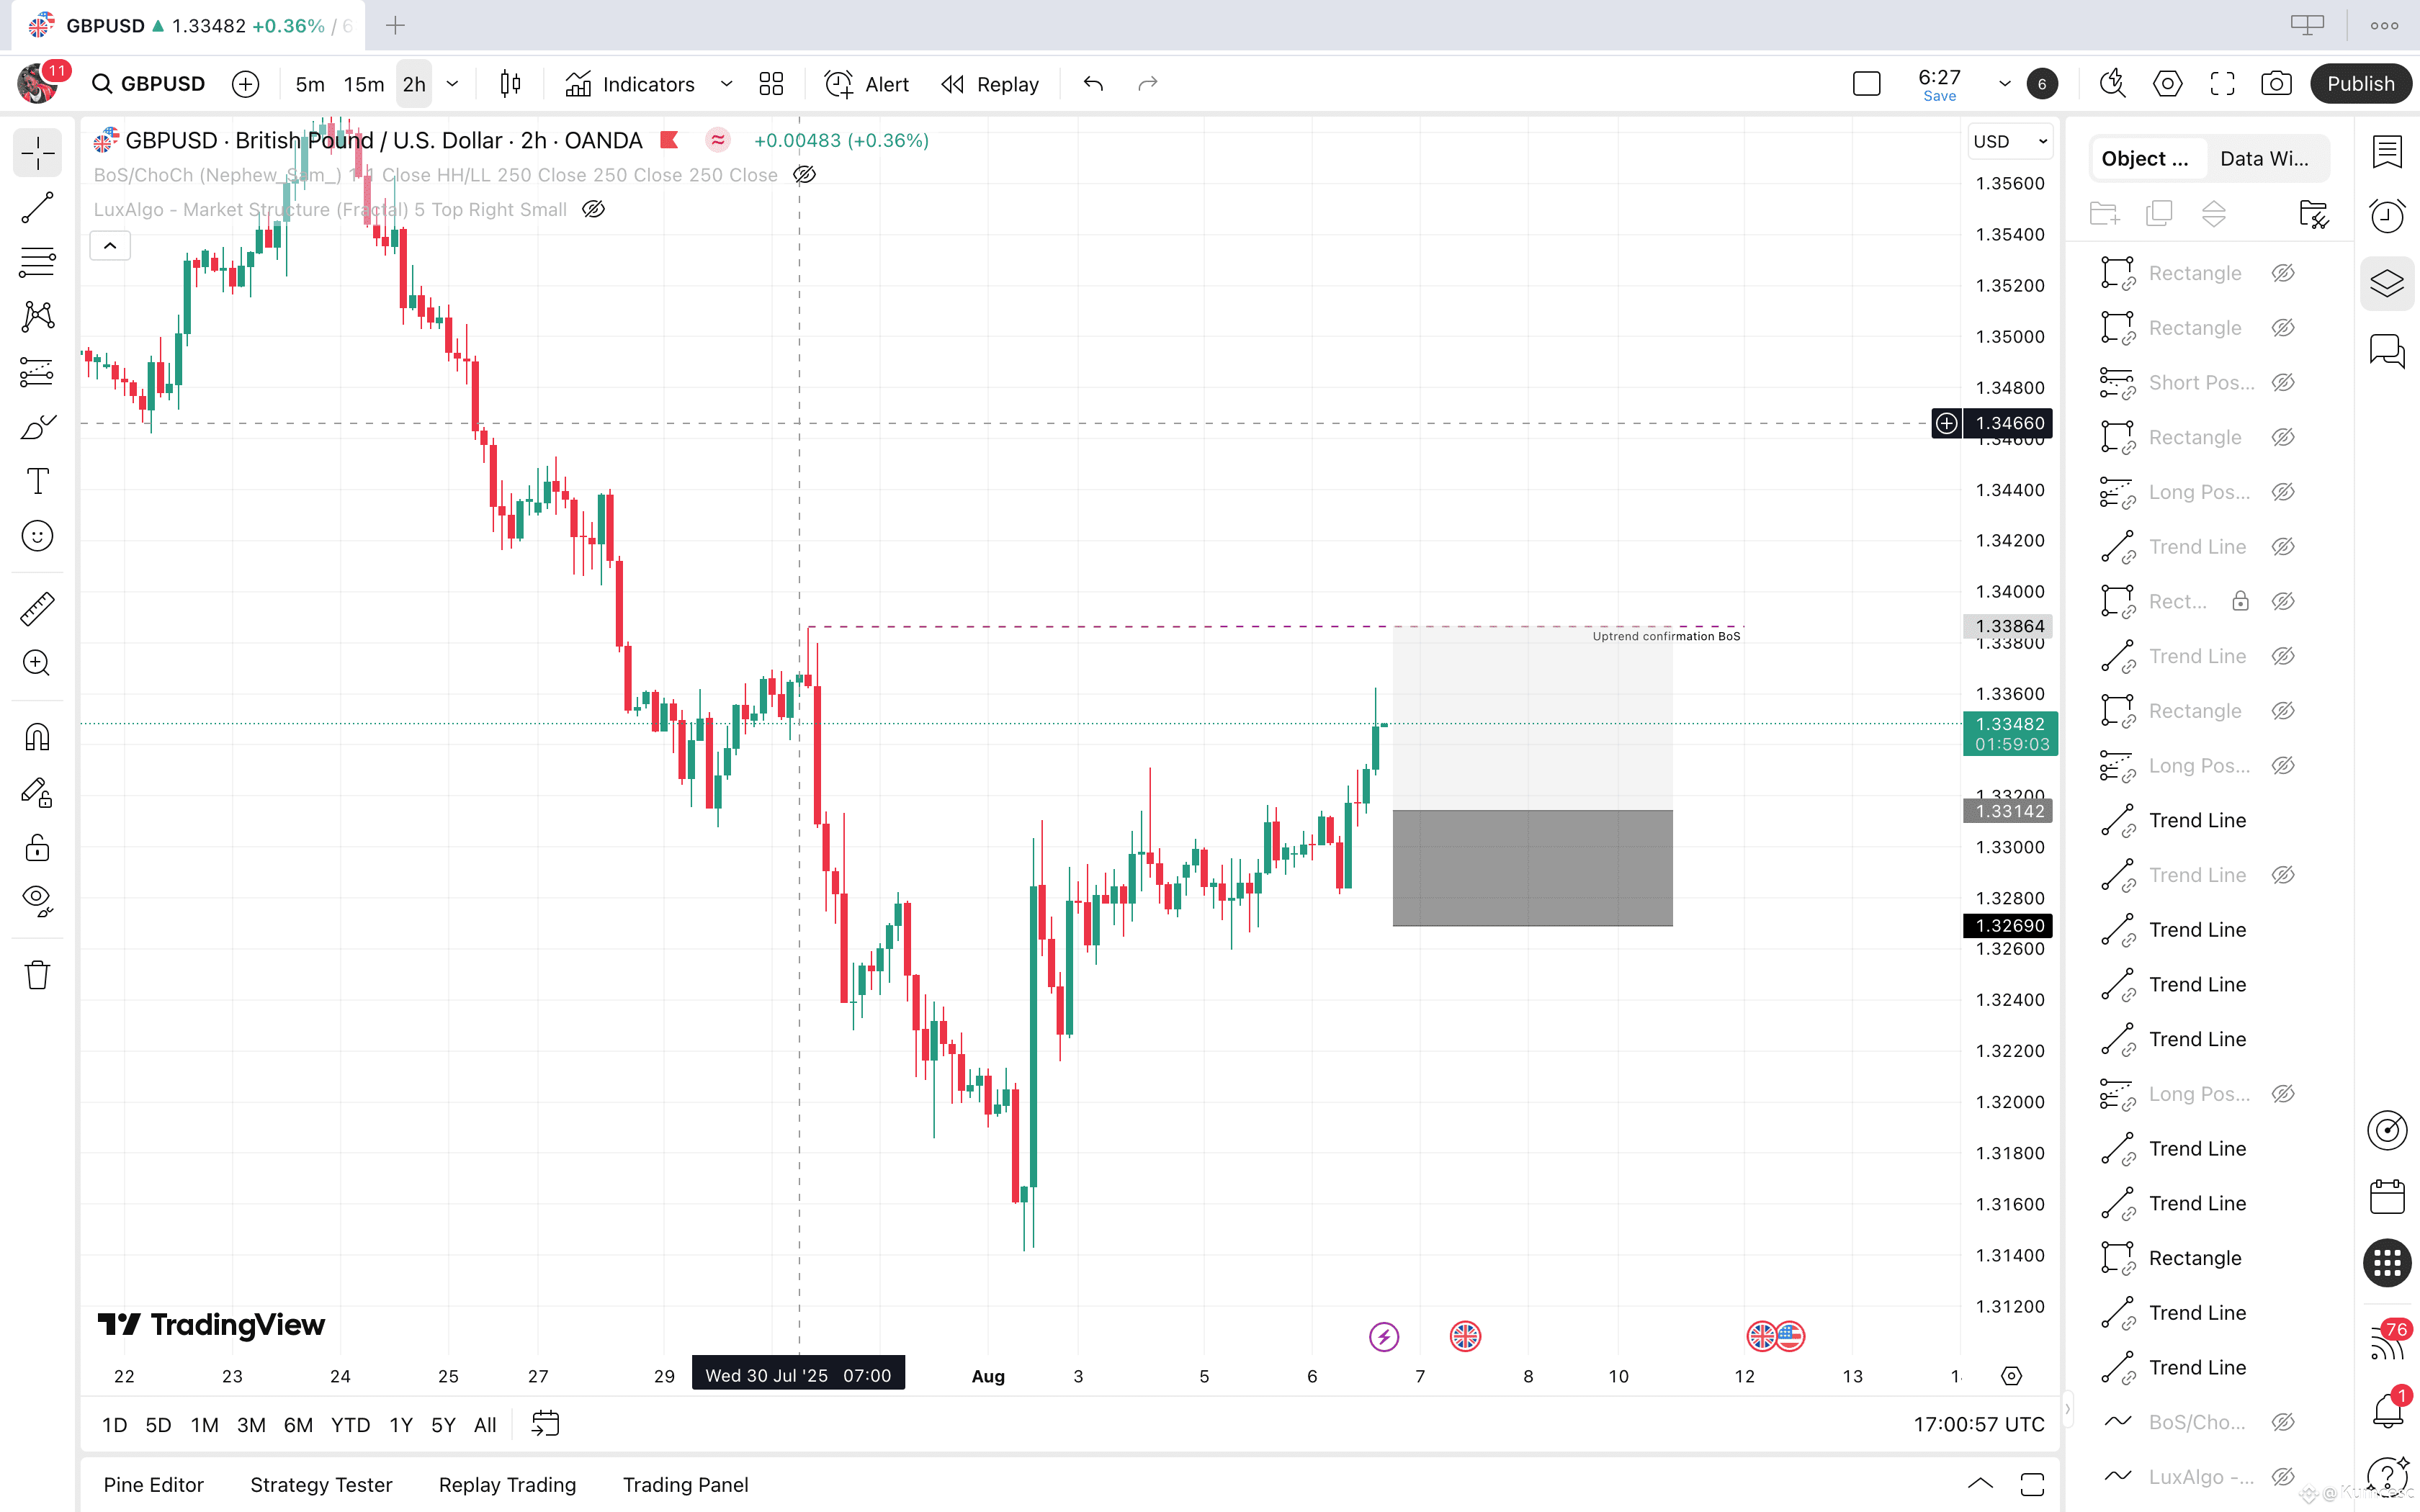
GBP/USD: The GBP/USD chart also displays a downtrend through the last days of July, followed by a breakout and continuation of an uptrend as it pushes towards 1.3360 in early August.
Similarity: Both charts show a similar price movement pattern— a downtrend followed by a sudden upward shift in August. This suggests a correlation in market sentiment during the transition from July to August, indicating potential recovery or demand increase across both markets.
2. Volume and Volatility
BTC/USDT: There is noticeable volatility within Bitcoin's price action as seen from the large candlesticks, indicating significant price swings. Despite the volatility, the recent bullish movement is quite strong.
GBP/USD: GBP/USD also exhibits sharp moves with similar volatility, but the scale is relatively smaller compared to Bitcoin. The movement is still significant as the pair moves above 1.33, signaling strong upward momentum after breaking resistance.
Divergence: The volatility in BTC seems more pronounced than in GBP/USD, suggesting that the cryptocurrency market may be more reactive to news and events than traditional Forex markets like the British Pound.
3. Support and Resistance Levels
BTC/USDT: Bitcoin recently found support at 111,900 and saw a strong rebound, confirming 111,900 as a solid support level. Resistance is approaching 116,000, indicating a bullish rally in progress.
GBP/USD: For GBP/USD, the support is around 1.3200, with the price breaking through several resistances along the way to 1.3360, indicating significant upward momentum.
Similarity: Both charts have a clear support and resistance structure, with prices rebounding off key support areas, indicating that price action is respecting these levels, regardless of market type.
4. Market Sentiment and Direction
BTC/USDT: The shift from a downtrend to an uptrend in Bitcoin’s price suggests strong bullish sentiment, particularly in the cryptocurrency space, which may be influenced by broader market conditions or specific news events.
GBP/USD: Similarly, the GBP/USD chart shows a shift in sentiment, indicating a potential reversal from a bearish to a bullish trend in the Forex market. However, GBP/USD may be more influenced by geopolitical or economic events, such as interest rates or UK political changes.
Divergence: While both markets are moving in the same direction (upward), the fundamental drivers behind the movement may differ. BTC is more affected by cryptocurrency-specific news, while GBP/USD is influenced by economic data and geopolitical factors.
5. Technical Indicators
BTC/USDT: Bitcoin’s price action indicates strong momentum as it breaks recent price levels with increasing volume. The relative strength index (RSI) or other oscillators might show the strength of this move.
GBP/USD: The GBP/USD chart also shows a breakout pattern from a consolidation phase, with increasing momentum. However, the indicators might show a more gradual increase compared to BTC.
Similarity: Both pairs are showing signs of strength and momentum, but BTC’s breakout seems more volatile and rapid, typical of cryptocurrencies.
Conclusion:
Similarities: Both BTC/USDT and GBP/USD charts demonstrate a recovery from a downtrend into an uptrend, indicating a potential shift in market sentiment toward bullishness.
Divergence: While they share similar patterns, Bitcoin's movements are more volatile, showing larger price swings, while GBP/USD appears to have more gradual and stable changes, typical of traditional currency pairs.
This analysis of Bitcoin and the British Pound demonstrates how different asset classes (cryptocurrency vs. traditional forex) can display comparable price structures while behaving differently in terms of volatility, sentiment, and responsiveness to broader market conditions.
Stay tuned for more in-depth analysis on Binance Square!


