The Bitcoin price is struggling to break through the $116,200 mark. BTC is currently in a consolidation phase and may further break below the $112,500 mark.
Bitcoin is starting to fall again from the $115,500 region.
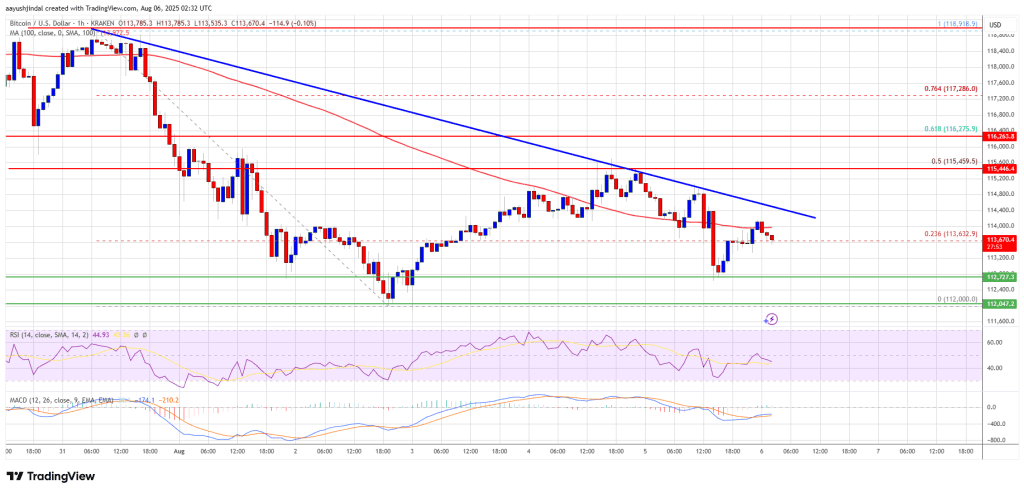
The trading price is below $114,000 and the 100-hour simple moving average.
A bearish trend line has formed on the hourly chart for BTC/USD, with resistance at $114,400 (data from Kraken).
If the resistance zone of $115,500 is broken, the currency pair may start to rise again.
Bitcoin price faces resistance
The Bitcoin price found support around $112,000 and initiated a rebound. BTC successfully broke through the resistance levels of $113,200 and $114,000.
The price has risen above the 23.6% Fibonacci retracement level of the downward trend from the swing high of $118,918 to the low of $112,000. However, bears are active near the resistance level of $115,500, making it difficult for the price to continue rising.
The current trading price is below $114,000 and the 100-hour simple moving average. A bearish trend line has also formed on the hourly chart for the BTC/USD currency pair, with resistance at $114,400.
 Direct resistance in the upward direction is around $114,000. The first key resistance level is around $115,000. The next resistance level may be $115,500. If the closing price breaks above the resistance level of $115,500, it could further push the price higher. In this case, the price may rise and test the resistance level of $116,500. If it continues to rise, the price may head towards $118,000. The main target may be $120,000.
Is BTC falling again?
If Bitcoin fails to break through the resistance level of $115,000, it may fall again. The current support level is around $113,200. The first major support level is around $112,500.
The next support level is currently around $112,000. If the price falls further, it may drop towards the support level of $110,500 in the short term. The main support level is at $108,500, and if it breaks below this support level, BTC may continue to fall.
Technical indicators:
Hourly MACD - The MACD is currently accelerating in the bearish zone.
Hourly RSI (Relative Strength Index) - The RSI for BTC/USD is now below the 50 level.
Major support level - $112,600, followed by $112,000.
Major resistance levels - $115,000 and $115,500.

