Ten years ago, I entered the crypto world with 30,000 yuan.
At that time, I was like you - full of dreams of getting rich, fantasizing about an overnight transformation.
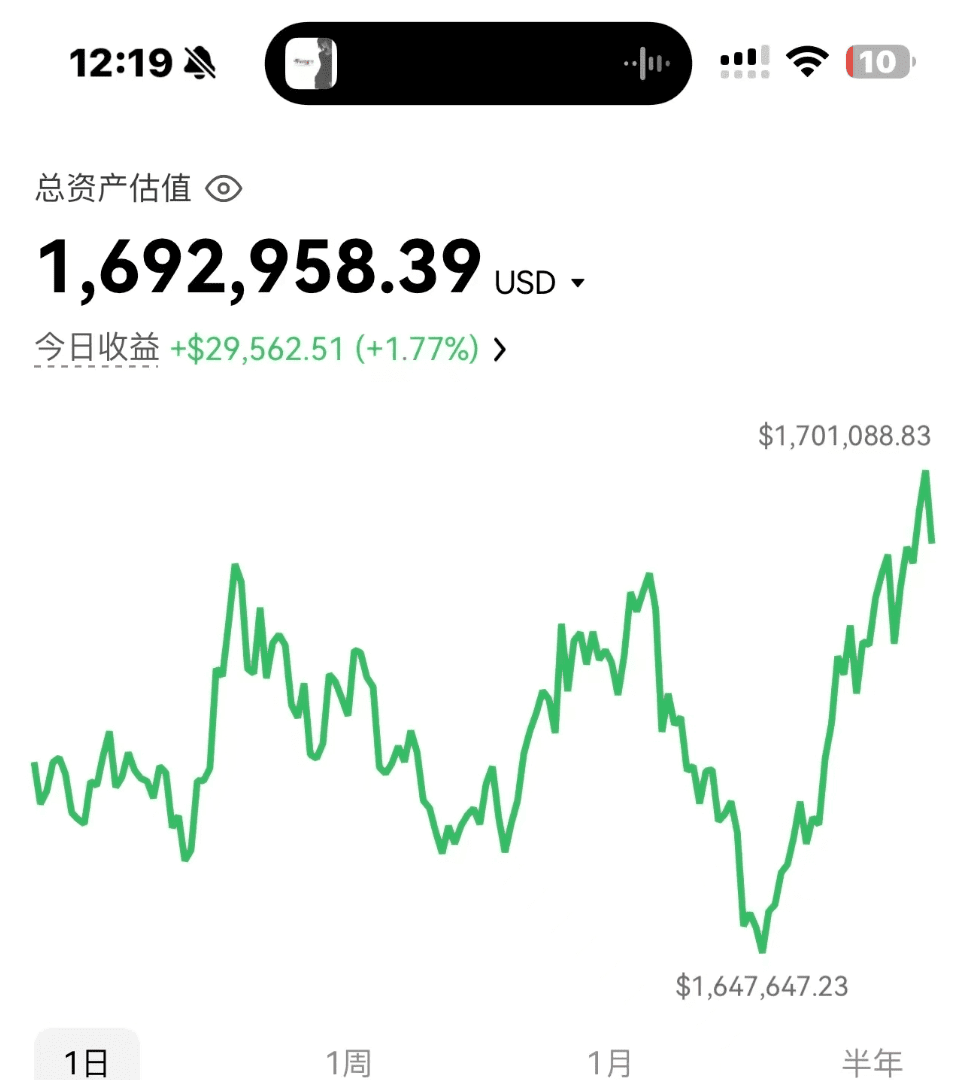
Ten years later, my assets exceeded ten million.
But along the way, witnessing countless people get liquidated, cleared out, and exit the market, losing even their pants, I realized:
The truth of the crypto world has never been about who makes money quickly, but who dies slowly.
Today, I won't talk about clichés, just the essentials - understanding these points can at least help you save five years of tuition fees.
1. Want to make money? First, don't die!

✅ 1. Risk control is not a technique, it is a protective charm!
• Most common ways beginners fail: going all in, chasing heights in altcoins, and clearing out in three days.
• My bottom line rules:
• Capital is divided into five parts, using only one part each time.
• If a single trade loses over 10%, immediately close the position.
• Losing over 20% in a month, shut down the computer immediately.
• Don't fantasize about 'breaking even'; surviving is the first hurdle.
✅ 2. In the face of trends, don't pretend to be a hero.
• You can hold a big bull market not because you are smart, but because you understand the times.
• Key signal:
• 30-day line + 120-day line moving upwards in sync = bull market profits.
• Divergence of moving averages downwards = bear market traps.
📌 Remember: the market is a big river; you should float with the current, not row against it.
✅ 3. Less is more, the more precise the indicator, the more ruthless.
I am currently only focused on two signals:
• MACD golden cross + volume increase = entry signal.
• Decreasing volume with rising prices = baiting the bulls, increasing volume with falling prices = true collapse.
Trading cryptocurrencies is not about who uses more indicators, but who reacts quickly and acts decisively.
2. The three major pitfalls in the crypto world, 99% of newcomers fall into.
🚫 1. Long-term belief will ruin you without discussion.
• Aside from BTC/ETH, holding other coins for three years = chronic liquidation.
• I witnessed firsthand: holding a certain altcoin stubbornly in 2018, from $10 to $0.1.
• My current setup:
• BTC/ETH bottom support.
• Clear out altcoins when they reach target levels, never get attached.
🚫 2. Leverage is the devil, not an ATM.
• Yes, 10 times leverage doubling is delightful.
• But I've also seen real stories of 30 million going to zero in a day.
💥 Suggestion:
• Newcomers shouldn't touch leverage within two years.
• Experienced traders can open a maximum of 5 times, with position control within 30%, no limit on stop-loss = looking for death!
🚫 3. Hotspots ≠ opportunities, they are the grave of retail investors.
• When AI coins, meme coins, and DeFi surge, the main players are gradually unloading, while retail investors rush in to catch the falling knife.
• I only trade these two coins:
• Bottom consolidation for more than three months.
• Breakout with increased volume + on-chain anomalous data support.
Missing opportunities is not scary; stepping on a landmine is deadly.
3. Short-term vs. long-term, the key lies in the market phase.
Bull market = ride the waves.
• Position structure: BTC/ETH + leading sectors (e.g. Layer2).
• If the moving average hasn't broken, hold tight, don't be scared off by pullbacks.
Bear market = quick in and out.
• Only look for short-term opportunities, focusing on 15min/1h charts.
• Make 3-5% profit per trade and withdraw, prioritizing risk management.
⚠️ Always keep 30% cash flow - this is your lifeline and the spark for your next comeback.
Final advice:
The crypto world can indeed lead to a turnaround, but it only rewards those who are patient and disciplined.
In the past 10 years, I have lost money, been liquidated, and almost exited the market.
Being able to reach today is not because I am particularly talented, but because I always remember one phrase:
Do the simple things to the extreme, and luck will naturally come.
If you are still losing money, you might as well stop trading for now and read this article a few times.
Trust me, the market does not reward those who are impatient.
The money in the crypto world is never 'traded' out, but 'endured' out.
Full-time trading of cryptocurrencies, the secret that gives me a stable income of over ten thousand U every day: (day trading skills and points to note) Save it with one click! Once learned, making money in the crypto space is as simple as breathing!
1. Market sentiment and emotions can be analyzed from changes in trading volume and open interest to assess the strength of bullish and bearish sentiment.
Increasing volume without a price drop may indicate a bottoming out, while increasing volume without a price rise may indicate a short-term peak.
The volume requirements in the rising and falling processes are different.
The rising process: continuous and uniform volume increase is needed. In a 3-minute candlestick chart, uniform volume increase indicates that the upward trend will continue. If a significant decrease in volume occurs,
Or if there is a very large volume, the rise may have come to an end.
In the downward process: as long as volume increases when breaking some key levels, the downtrend will continue.
When the price no longer rises at a certain level, but the positions continue to increase, with buy and sell orders at increasingly lower prices, it indicates that the price may fall.
Increasing positions while stagnating in price is a very good shorting opportunity, or increasing positions while stagnating in price is likely to rebound.
2. Key points. Draw trend lines, resistance, and support on the chart. When the price reaches or breaks through these key points, take swift action.
I personally use Fibonacci retracement to predict pressure and support.
3. Trading rules. You can only trade one variety during a specific time period.
Continuously track the varieties you are trading until they no longer hold speculative value before giving up.
4. Market observation window: one-minute window - this is prepared for grasping entry and exit timing;
3-minute window -- this is used to monitor the wave situation after entry;
30-minute or 60-minute window - used to monitor intraday trend changes at any time.
Here is a reminder for everyone: When opportunities arise, if stopped out, do not rush to try to recover immediately.
If you stop-loss, that trade is complete; the next trade is a new one, and whatever you earn is what you earn. Don't let previous operations dictate the target for the next operation; otherwise, you'll lose every time.
In the crypto world, making a million means 'either rely on a bull market + hold on, or rely on hitting the right coin, or rely on high leverage to bet in the right direction.' But most people lose money, so don't just look at the rags-to-riches stories; first, think clearly about how much risk you can bear. If you're also a tech enthusiast in the crypto world, click on the homepage.
Click on the avatar to follow me and gain firsthand information and in-depth analysis!
This is my personally tested trading method: Momentum trading must learn practical strategies | Comprehensive guide to the AO indicator: Zero line crossover, saucer signal, double peak pattern all at once.
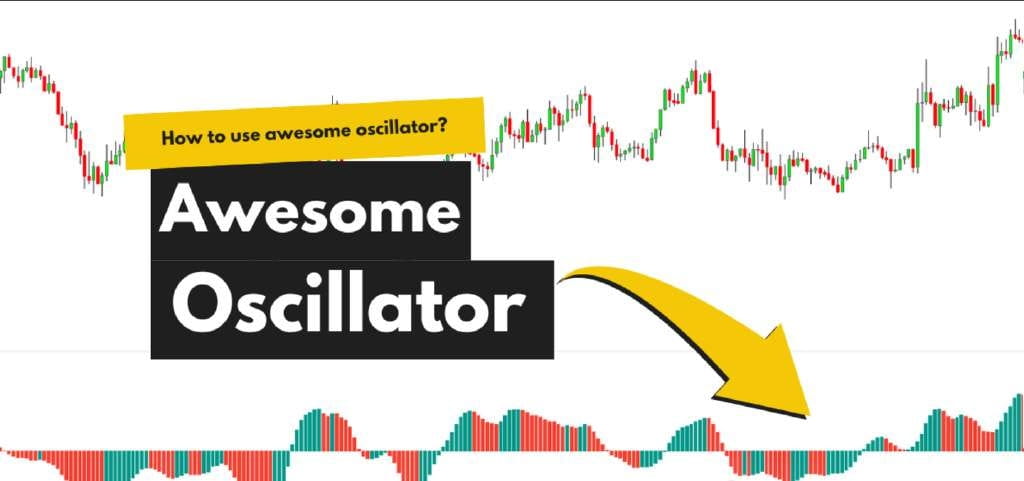
Bill Williams' Awesome Oscillator (AO, momentum oscillation indicator) strategy is actually a very practical momentum trading method, mainly used to capture the most direct and obvious trend changes. It is somewhat similar to the 'breakout triangle strategy' because it does not casually give you entry signals; it will only remind you to enter when momentum truly confirms that prices are starting to turn. In simple terms, momentum trading strategies are tools that help traders easily grasp short- and medium-term trends.
The AO indicator is often called a 'super indicator' because many people perform very well when trading with it. This AO trading method designed by Bill Williams does not discriminate against market environments; it can be used in the crypto space, stocks, commodities, stock indices, and foreign exchange. Moreover, after conducting extensive research and backtesting, they found that the daily chart is the time frame where this strategy performs best, so it's recommended to mainly use it on the daily level.
Before we formally start talking about how to use it, we need to clarify that to use Bill Williams' AO strategy, you actually only need one indicator - the Awesome Oscillator itself.
What is the AO indicator?
The principle of AO is also quite simple: it compares the momentum of the most recent several candlesticks with that of a previous period to see if the short-term is accelerating or weakening. Through this comparison, we can judge whether the market is about to start reversing.
Additionally, if you want to delve deeper into other momentum indicators, such as MACD, we also recommend checking out the MACD trend-following strategy, which is also a very mature and ready-to-use trend trading strategy.
So what are the parameter settings for the indicators?
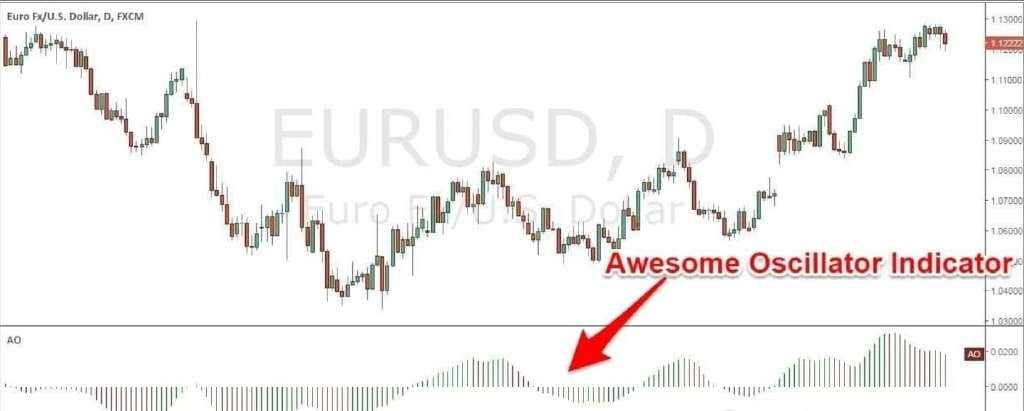
The default parameters of the Awesome Oscillator (AO) indicator are 5 periods against 34 periods.
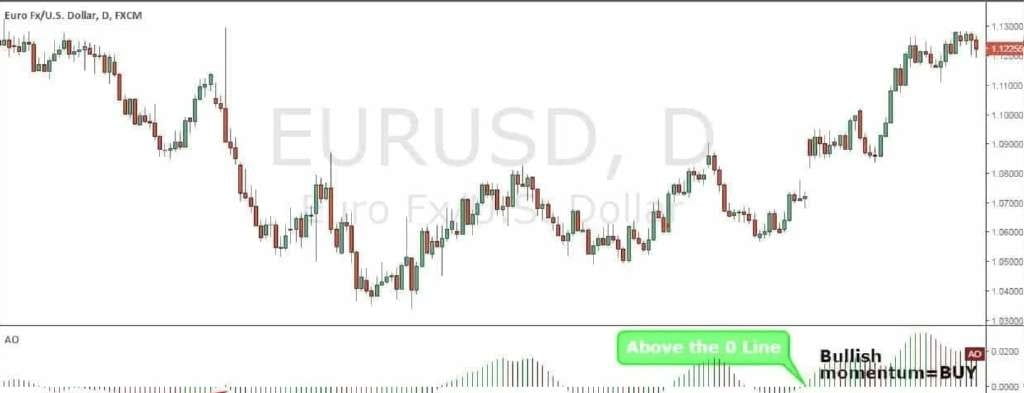
It's simple, if the AO histogram crosses above the zero line, it indicates bullish momentum, and the market may start to rise; conversely, if it crosses below the zero line, it indicates bearish momentum, predicting that prices may fall.
So how to use the AO indicator?
The Awesome Oscillator designed by Bill Williams is actually a very versatile tool; you can use it to:
1. Utilize trends.
2. Assessing market momentum.
3. Anticipate possible trend reversals.
The simplest and most direct way to use the Williams Awesome Oscillator is the zero line crossover method. However, it also has other unique signals, such as the Awesome Oscillator Saucer, Twin Peaks, or bullish/bearish divergence, which can help you capture trading opportunities more flexibly and accurately.
How to use the Awesome Oscillator zero line crossover method.
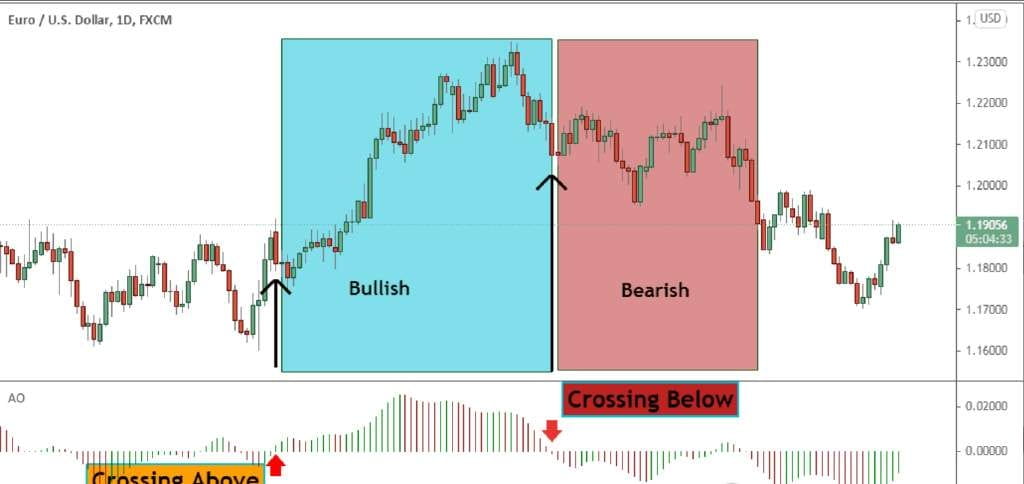
In simple terms, the zero line crossover is used to measure changes in market momentum:
1. When the Awesome Oscillator crosses above the zero line, it indicates bullish momentum and a potential trend reversal.
2. When the Awesome Oscillator crosses below the zero line, it indicates bearish momentum and a potential trend reversal.
Please see the AO chart example below:
When AO crosses above the zero line, it indicates that short-term momentum is rising faster than long-term momentum.
This information is very useful because changes in trend direction always first appear in the short-term trend before spreading to the long-term trend.
Clearly, this is a reversal signal.
You might already be familiar with zero line crossover signals, as this is a common trading signal in many technical indicators.
However, compared to other oscillators, the Awesome Oscillator often gives far fewer false signals.
Please refer to the AO chart below:
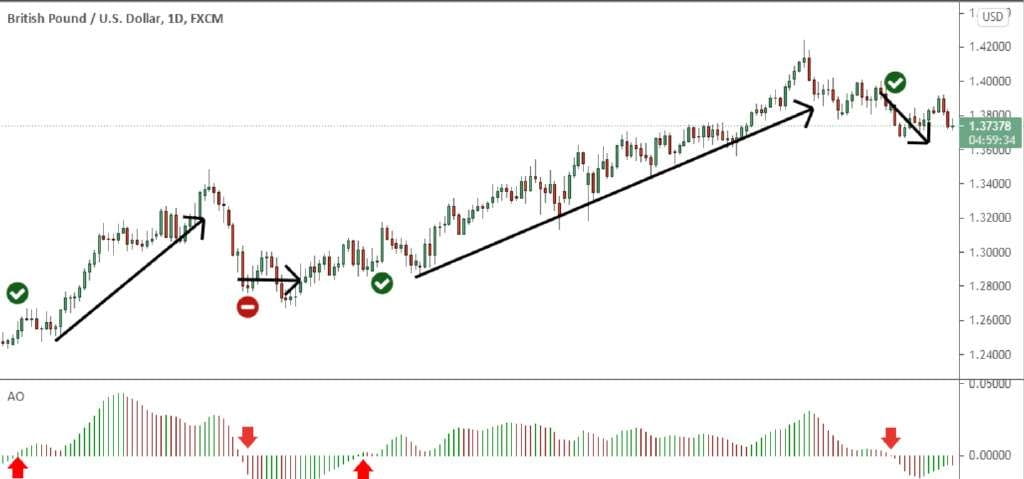
Among the four zero line crossover signals, only one is a false signal.
In comparison, the MACD indicator generates more signals, hence inevitably leading to more false signals.
Please see the example chart below:
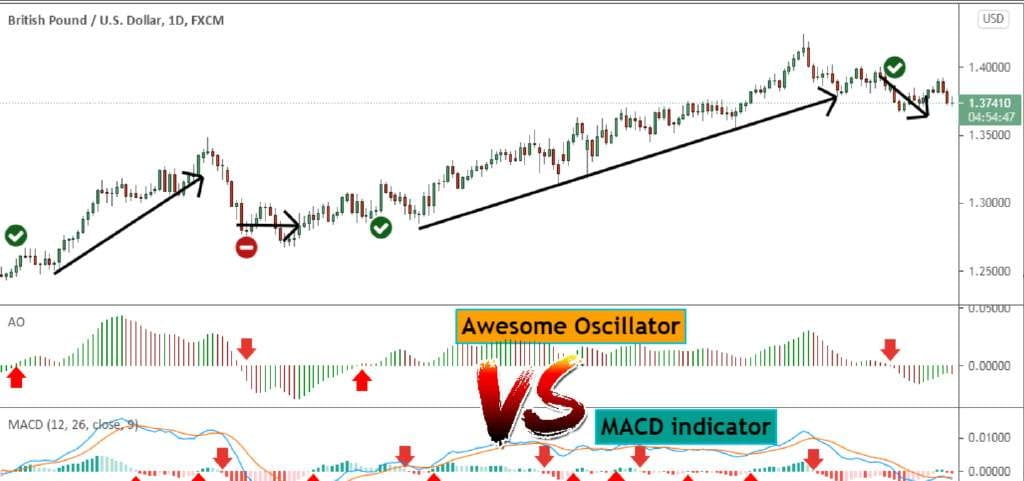
The conclusion is as follows:
In a strong trending market, the Awesome Oscillator will help you continuously hold trending positions, while other momentum indicators may cause you to prematurely stop out during minor pullbacks or adjustments.
Next... Let's introduce another secret signal of the Awesome Oscillator.
What is the Awesome Oscillator Saucer signal?
The AO's 'saucer signal' is used to help you capture pure momentum continuation opportunities.
In simple terms, if you didn't catch the trend's starting point, the AO saucer signal is equivalent to giving you a 'second chance to get on board', or it can be used to more easily increase your position and build your holdings.
To be honest, we traders have all encountered situations like this: watching the market start, but missing the good entry points. As a result, to avoid missing out (FOMO), we often chase orders at inappropriate places, ending up trapped or losing money.
So what to do?
The solution is not to blindly chase highs and cut losses but to learn how to use the AO saucer signal to 'smartly' re-enter the market.
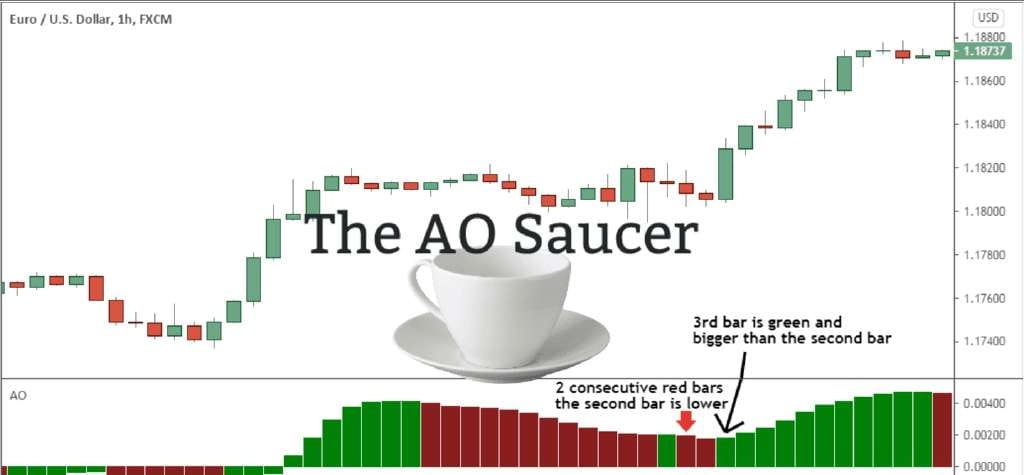
The so-called 'saucer pattern' is actually very simple: it's three consecutive bars on the AO histogram, all either above or below the zero line.
The bullish saucer pattern needs to meet the following four conditions:
1. AO histogram is above the zero line.
2. Two consecutive red bars appear.
3. The second red bar is lower than the first red bar.
4. The third bar is green and higher than the second bar.
Please refer to the Awesome Oscillator chart below to understand the above meaning:
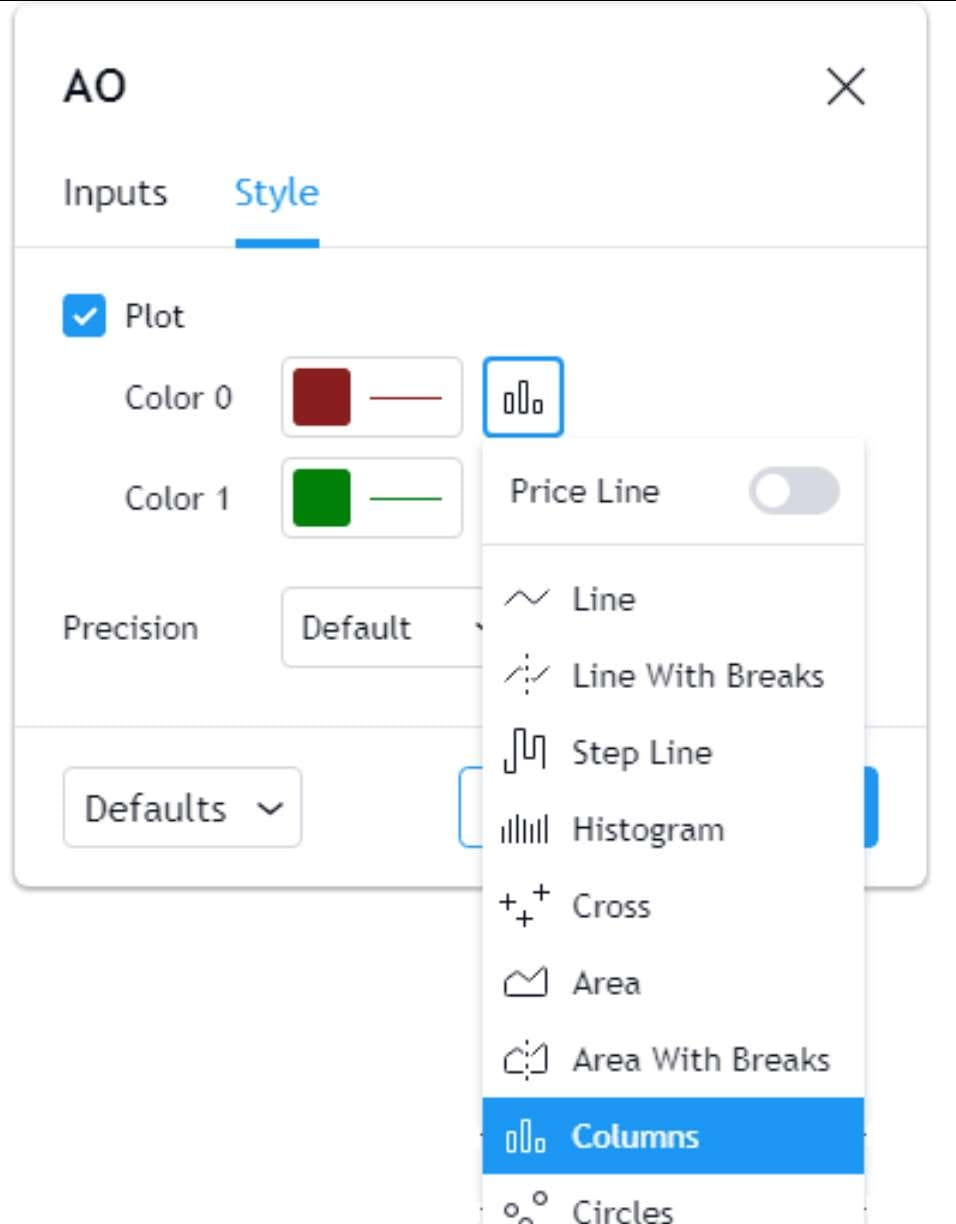
Note: To observe more clearly, we need to change the Awesome Oscillator settings from 'Histogram' to 'Columns'.
If you want to learn how to change the AO settings yourself, just click the gear icon on TradingView, select 'AO Style', and switch 'Histogram' to 'Columns'.
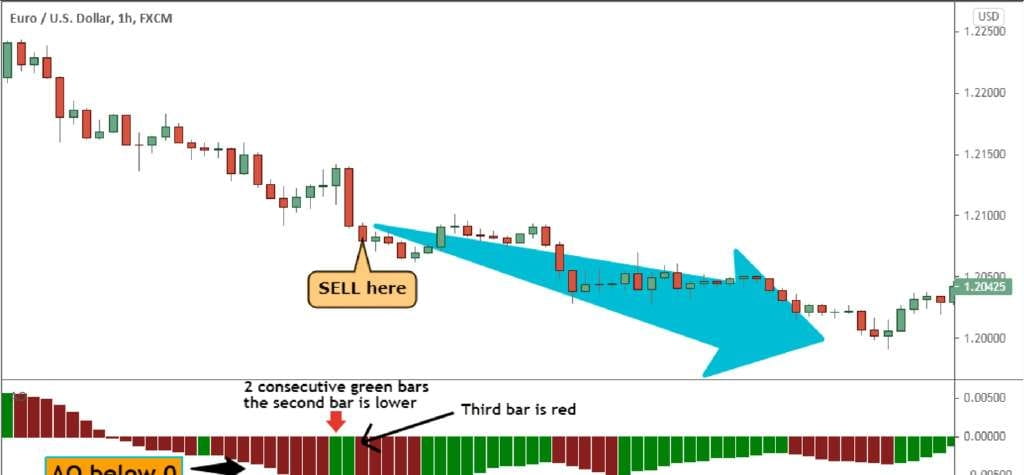
As you may have already noticed, the Awesome Oscillator's saucer signal is used to measure short-term changes in trend speed. Conversely, the bearish saucer signal appears when the following four conditions are met:
1. AO histogram is below the zero line.
2. Two consecutive green bars appear.
3. The second green bar is lower than the first one.
4. The third bar is red and lower than the second green bar.
Please see the example chart below:
The last Awesome Oscillator signal is the twin peaks signal (Twin Peaks).
Next, we will provide a detailed explanation of a step-by-step trading strategy surrounding the double peak signal.
Now, let's move to the most important part of this article - the trading rules of Bill Williams' Awesome Oscillator trading strategy.
Before we continue, we always recommend that you write down these trading rules on paper.
Bill Williams' Awesome Oscillator strategy rules (long trade rules).
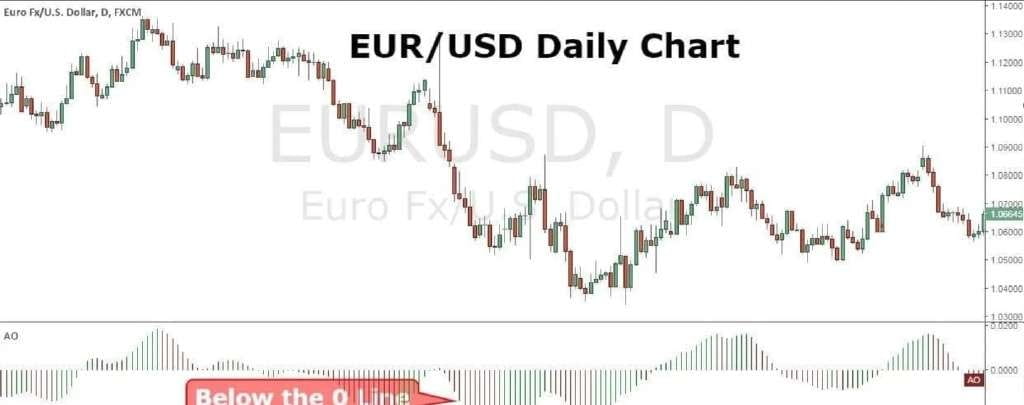
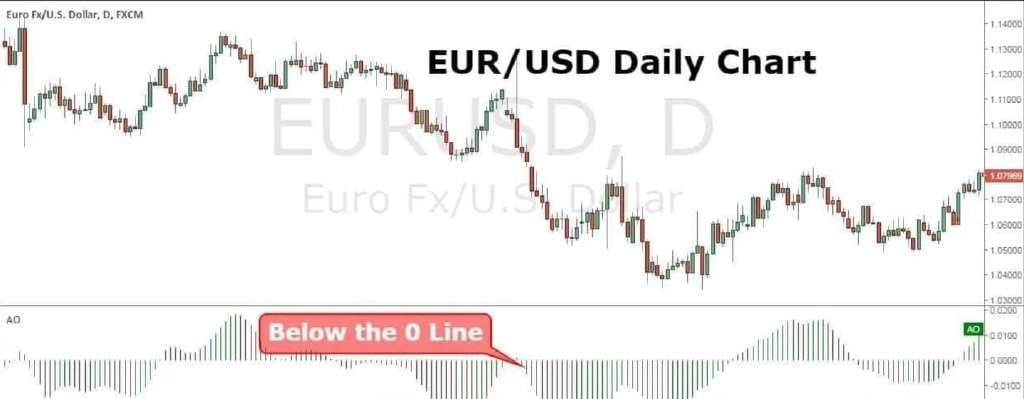
Step #1: Check if the Awesome Oscillator indicator is below the zero line.
First, we need to ensure that the Awesome Oscillator indicator is below the zero line. This first step is part of a pattern that contains three rules, called the Awesome Oscillator Twin Peaks.
Don't worry, once we finish explaining the three rules, you will understand more clearly.
Step #2: Check if the Awesome Oscillator indicator has two wave lows, and that the second low is higher than the first low.
Next, you need to confirm whether the Awesome Oscillator histogram has two consecutive wave lows, and that the second low is higher than the first low. These two fluctuations will form what is called the twin peaks pattern (Twin Peaks), and the name 'Awesome Oscillator double peak' comes from this.
To truly establish the double peak pattern of the Awesome Oscillator, the last rule must also be satisfied.
Step #3: Check if the Awesome Oscillator histogram immediately turns green after the second low.
We need to confirm that after the second low, the AO histogram immediately turns green. This step verifies the validity of the Awesome Oscillator double peak pattern. When the AO histogram turns green, it means buyers start to intervene, but only when it breaks above the zero line does it count as a real market sentiment shift signal.
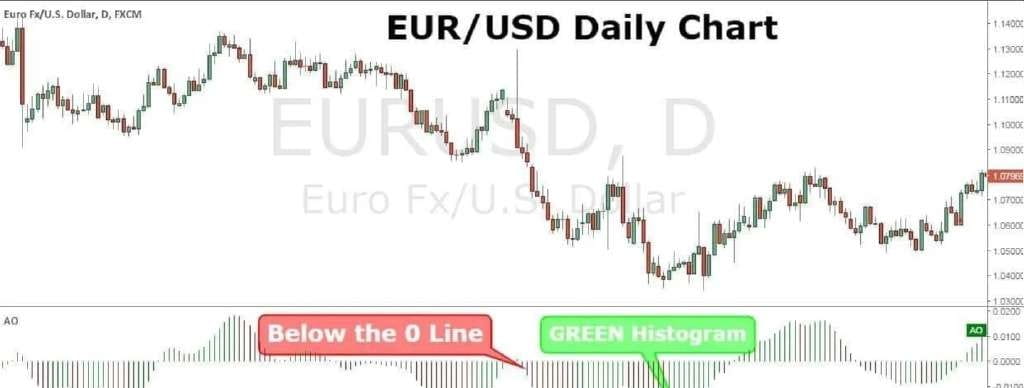
Now, the double peak pattern of the Awesome Oscillator has been completed. However, we have not yet confirmed that buyers have taken control, which leads us to the next step of Bill Williams' Awesome Oscillator trading strategy.
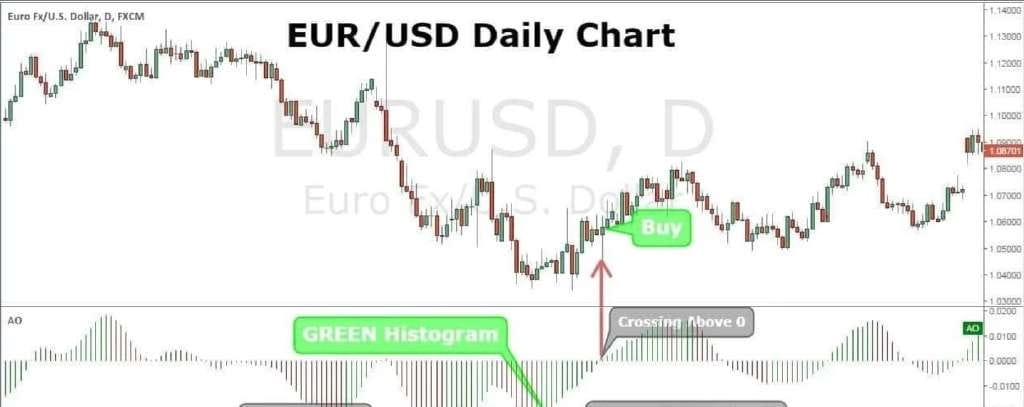
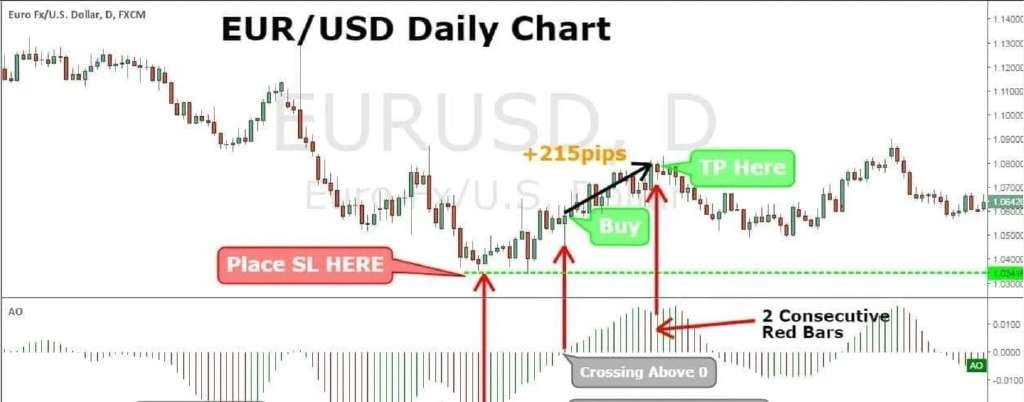
Step #4: Before buying at the current market price, wait for the Awesome Oscillator histogram to break above the zero line.
As we discussed earlier, when the AO indicator is above the zero line, it indicates positive momentum, while below the zero line indicates negative momentum. You will notice that the AO histogram bars oscillate around the zero line, even if the color changes between green and red, it still remains around the zero line.
This actually represents different degrees of momentum strength. However, the real market sentiment shift occurs when the AO histogram breaks above the zero line, and that's why this is our entry signal.
At this point, you have opened a position, but we still need to determine the stop loss and take profit levels, which is the next step of the strategy.
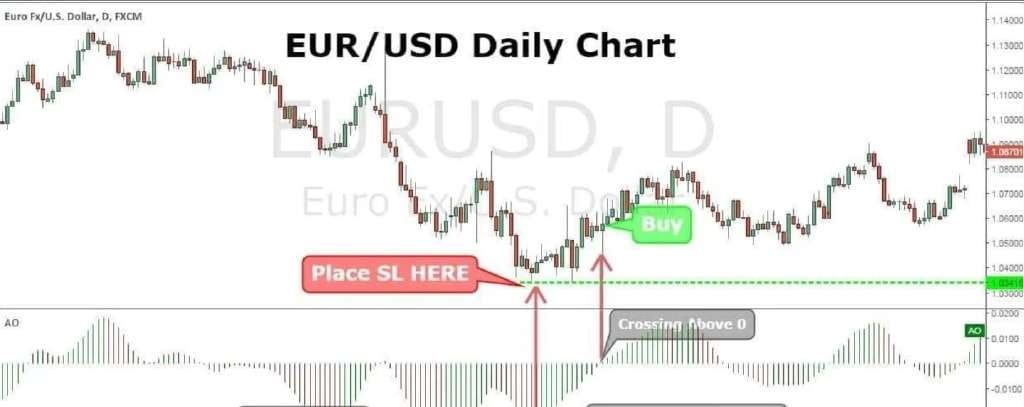
Step #5: Set protective stop-loss below the recent wave low that should align with the second wave low of the AO double peak pattern.
The AO histogram usually remains consistent with price trends. Therefore, when the price forms a wave low, the AO histogram should also show a corresponding low.
We do not want to leave any buffer below this wave's low point, as any slight breakdown will invalidate the AO double peak pattern.
Now, the only part that still needs to be clarified is where to take profits, which leads us to the last step of Bill Williams' Awesome Oscillator trading strategy.
Step #6: When the Awesome Oscillator histogram shows two consecutive red bars, immediately take profits.
We will immediately lock in profits as soon as the market shows signs of weakening for the first time. Specifically, for example, when the AO histogram shows two consecutive red bars, we will immediately close the position to take profits because the market is likely to reverse afterwards.
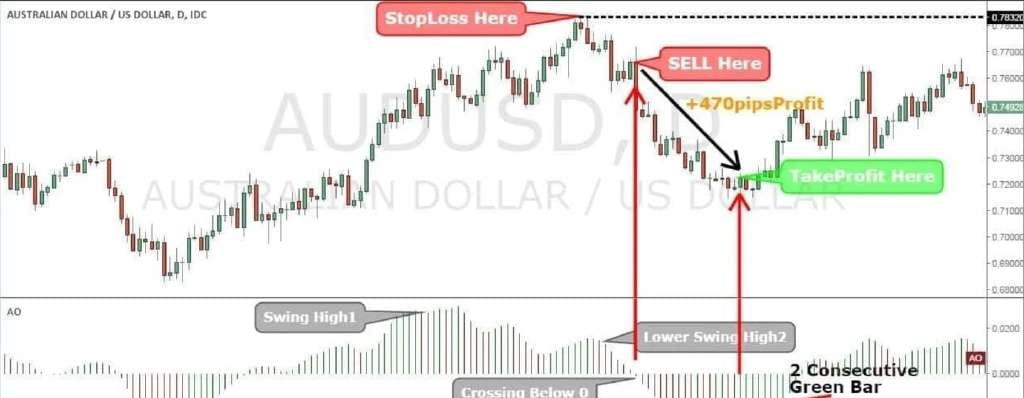
Note: The above content is an example of a long trade... For short trades, please use completely opposite rules. In the following figure, you can see a real short trade example using Bill Williams' Awesome Oscillator strategy.
Conclusion.
If you are doing momentum trading, Bill Williams' Awesome Oscillator (AO) strategy is really a very useful tool. Its idea is not to catch the very bottom or top but to enter when momentum truly shifts in our favor.
In simple terms, this method is a more advanced breakout trading method because true breakouts often signify a change in momentum. Moreover, the most classic and popular usage of the AO strategy is the double peak pattern, which, in most cases, can provide trading opportunities with particularly excellent risk-reward ratios.
Using this method, traders can make decisions more scientifically and clearly because the AO indicator can intuitively show changes in market momentum. This not only helps you analyze complex trends more easily but also makes it easier to find the most suitable entry and exit points, maximizing profits and minimizing risks.

Finally, I would like to share with everyone the 9 major rules of mastering the crypto world to become a millionaire in the crypto space!
1. Liquidity management principle. It is recommended to participate in cryptocurrency investments only with disposable funds, strictly avoiding market entry through leveraged financing or credit funds, and maintaining the health of personal balance sheets.
2. Value discovery strategy. Establish a systematic project evaluation framework, focusing on identifying quality projects with practical application scenarios, technical reserves, and compliance qualifications, and construct a multi-tiered asset allocation model.
3. Grid building mechanism. Implement a dynamic building plan in the target asset price range, gradually investing in batches to smoothen the holding cost and respond to short-term pullback risks brought by market fluctuations.
4. Risk hedging portfolio. Use a decentralized investment strategy across chains and sectors, control the position limit of a single asset, and construct a risk hedging matrix using low correlation between assets.
5. Building information advantage. Establish a multi-dimensional information monitoring system covering on-chain data analysis, regulatory policy interpretation, and market sentiment monitoring to form an information moat for investment decision-making.
6. Trend following rules. Identify market trend direction through technical indicators and fundamental analysis, avoiding premature counter-trend positions when trends are unclear, and maintain operational direction consistent with mainstream capital flow.
7. Leverage boundary control. Strictly adhere to leverage discipline in derivatives trading, suggesting that leverage multiples be maintained within a reasonable range (20-50 times), and set a mandatory liquidation line to prevent extreme risks.
8. Disciplined position management. Establish an investment discipline scorecard, actively reduce position exposure during increased uncertainty, and regularly rebalance the investment portfolio to avoid overtrading that erodes returns.
9. Behavioral risk management. Establish a quantitative investment decision-making process, clarify profit-taking and stop-loss standards, and overcome human weaknesses through programmatic operations, cultivating an anti-fragile investment mindset.
In the crypto world, making a million means 'either rely on a bull market + hold on, or rely on hitting the right coin, or rely on high leverage to bet in the right direction.' But most people lose money, so don't just look at the rags-to-riches stories; first, think clearly about how much risk you can bear. If you're also a tech enthusiast in the crypto world, click on the homepage.
Click on the avatar to follow me and gain firsthand information and in-depth analysis!
