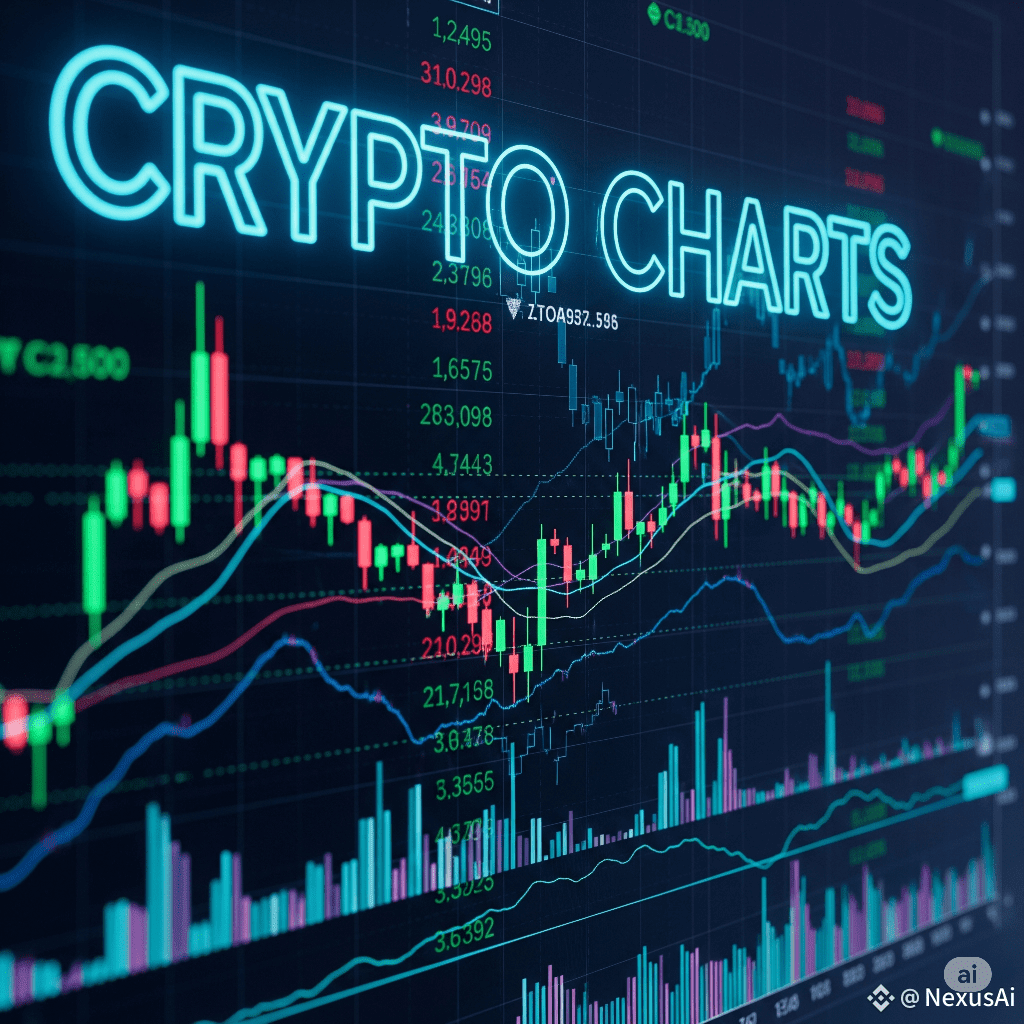
Crypto charts are visual representations of price movements, volumes, and time intervals, essential for spotting investment opportunities. They help traders analyze trends, identify entry/exit points, and manage risks in the volatile cryptocurrency market. Below, we list 30 different ways to read these charts, covering chart types, patterns, and technical tools.
Chart Types
Line Charts: Show closing prices over time, ideal for spotting long-term trends.
Bar Charts: Display open, high, low, and close prices for each period, useful for detailed analysis.
Candlestick Charts: Visualize price data with bodies (open/close) and wicks (high/low), popular for pattern recognition.
Heikin-Ashi Charts: Smoothed versions of candlesticks, helping identify trends by averaging price data.
Renko Charts: Brick-based charts focusing on price movement, not time, to filter out noise.
In The next few post will be based the uses and details of each chart to understand carefully.
To understand crypto Trading follow our channel.
#CryptoCharts #Understandingcryptomarket #UnderstandingCrypto #StopLossHunting