

Deconstructor of on-chain data: How Bubblemaps reshapes the information value chain of Web3
The transparency of blockchain is a double-edged sword. Although all transaction data is publicly available, the massive amount of on-chain information often presents itself in a raw and unordered state, making it difficult for ordinary users and even professional analysts to extract effective signals. This dilemma of data overload has led to a new demand—to transform the chaotic on-chain activities into actionable insights. The birth of Bubblemaps is precisely to address this core contradiction.
From transparency to readability: the value leap of information structure
The essence of Bubblemaps is an on-chain intelligent visualization engine, but its real innovation lies in its ability to deconstruct data. Traditional blockchain explorers like Etherscan can only provide linear transaction records, while Bubblemaps transforms raw data into network topology maps through token distribution mapping, wallet cluster analysis, and hidden relationship mining. For example, if the holders of a certain token are concentrated in a few related wallets, its price fluctuations may not be market behavior but rather the result of human manipulation. This structured presentation makes patterns that would originally require complex on-chain analysis easy to identify.
This capability has given rise to a new concept—InfoFi (Information Finance). If DeFi reconstructs the flow of funds through smart contracts, then InfoFi reconstructs the flow of information through data structuring. The role played by Bubblemaps is akin to Bloomberg terminals in financial markets, but its analytical dimensions lean more towards network effects of on-chain behavior rather than traditional fundamentals.
Visualization as a competitive barrier
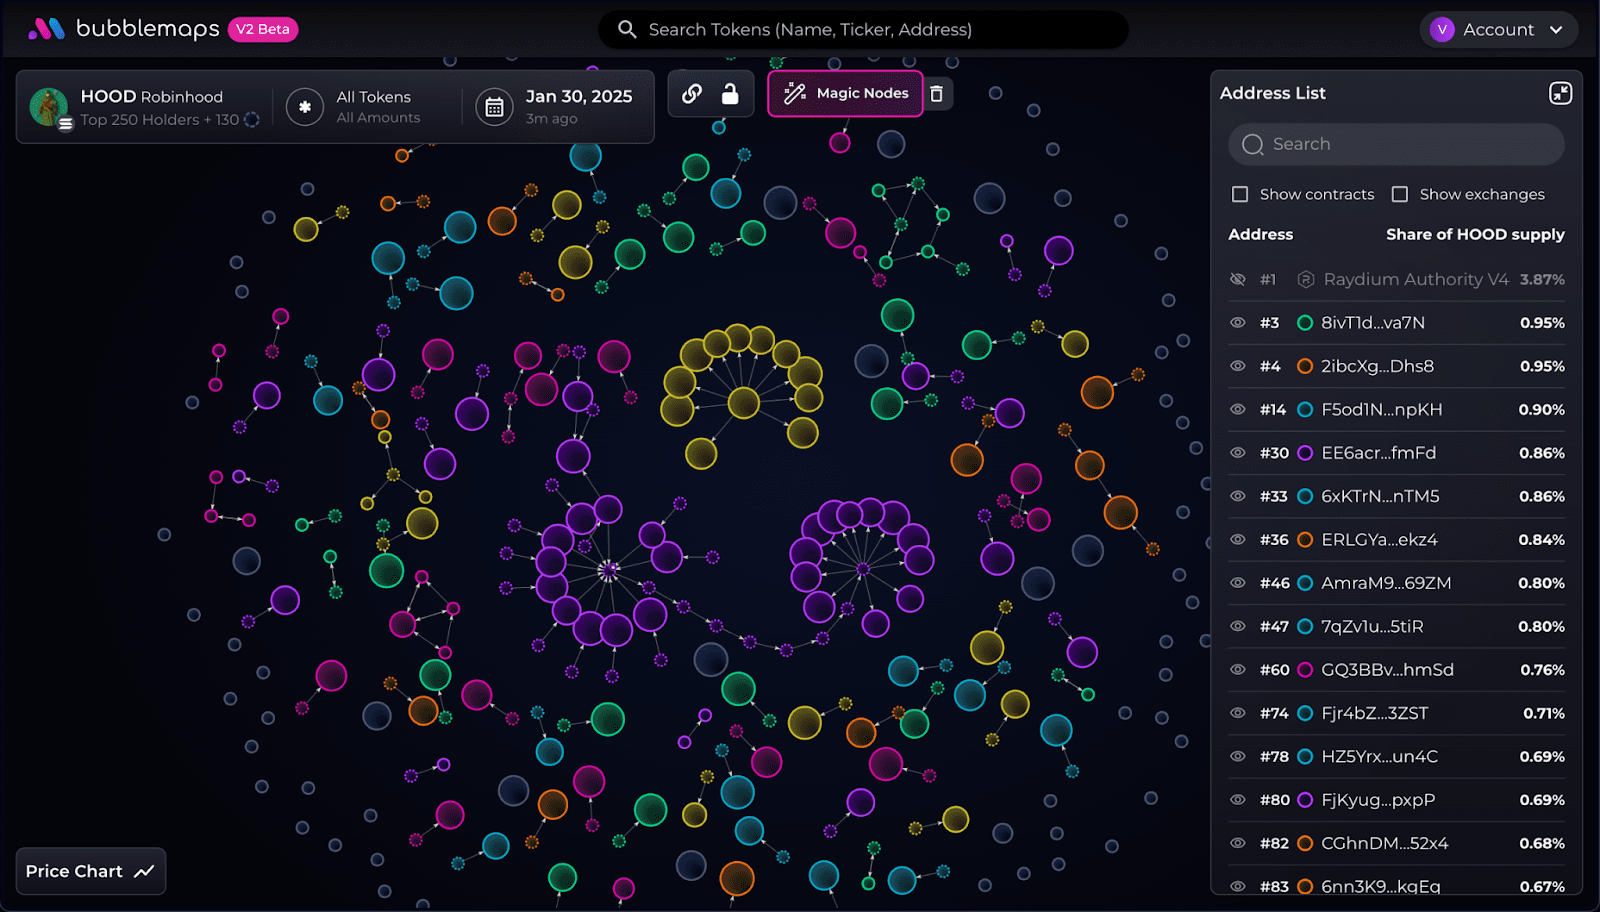
The interface design of Bubblemaps is its core differentiation. Unlike most data analysis tools, it abandons the conventional forms of data tables or dashboards and instead adopts bubble charts (Bubble Map) as the primary medium. Each bubble represents a wallet cluster, with its size reflecting the holding scale, color distinguishing the strength of association, and position implying the flow of funds. This design allows complex phenomena such as 'whale wallet manipulation' and 'exchange deposit and withdrawal anomalies' to be instantly recognized by non-technical users.
This low-threshold characteristic expands its user base. From MEME token traders on Pump.fun to institutional researchers on CoinGecko, anyone can directly discover arbitrage opportunities or risk signals through visual patterns without writing SQL queries or calling APIs. After integration into platforms like Etherscan and DEXScreener, Bubblemaps further embeds itself into users' workflows instead of existing as an independent tool.
Information leverage of token economics
The design of the $BMT token reflects Bubblemaps' pricing logic for information value. The token is not only used to pay for advanced analytical functions but also empowers a community-driven Intel Desk—a crowdsourcing layer where users contribute survey results. For example, when a user discovers an abnormal movement in a project team's wallet through Bubblemaps and submits a report, other users can vote on the conclusion by staking $BMT, and the verified information will become a trusted data source for the platform. This mechanism closes the loop of information production, verification, and consumption, forming a decentralized intelligence network.
It is worth noting that the application scenarios of $BMT are not limited to trading analysis. In the compliance field, it can be used to track hacker fund paths; within the InfoFi ecosystem, it may become one of the pricing bases for on-chain derivatives. This multi-layered utility design allows the token to move beyond being a mere governance symbol, resembling more of an 'information fuel.'
Invisible penetration of infrastructure
Bubblemaps' expansion strategy is intriguing. It has not chosen to directly promote to end-users but instead integrates into frequently used tools like Etherscan and Photon, becoming part of the underlying data layer. This 'parasitic growth' reduces customer acquisition costs while increasing migration barriers. When users view token details on CoinGecko, the holding distribution map of Bubblemaps is already embedded in the page by default—this means it is becoming the de facto standard for on-chain data analysis.
This penetration also reflects the trend of evolution in Web3 tools: vertical tools interlocking through APIs ultimately form a modular analysis stack. Bubblemaps occupies the ecological niche of 'visualization middleware' within this stack, neither needing to replace Etherscan's data retrieval functions nor competing with Nansen's on-chain tagging, but focusing on the intersection of both—transforming information into readability.
Reconstruction of the paradigm of on-chain intelligence
In traditional financial markets, information asymmetry is a core source of profit. While Web3 has eliminated data monopolies, it has created new asymmetries—specifically, asymmetry in information processing capabilities. The value of Bubblemaps lies in its ability to lower the threshold for this capability through visualization, allowing more participants to identify MEV opportunities, avoid Rug Pull risks, or discover early Alpha.
Future challenges may lie in information overload and noise. When everyone can easily read on-chain signals, excess returns may quickly diminish. However, Bubblemaps' moat precisely lies in its continuous algorithm iteration—how to extract deeper insights from the same raw data than others will be the next battleground in this InfoFi competition.